Journal of Behavioral Data Science, 2022,
2 (1), 1–34.
DOI:
https://doi.org/10.35566/jbds/v2n1/p1
The Lighting of the BECONs:
A Behavioral Data Science Approach to
Tracking Interventions in COVID-19 Research
Denny Borsboom$^{1}$ , Tessa F. Blanken$^{1}$ , Fabian Dablander$^{1}$ , Frenk van
Harreveld$^{1}$ , Charlotte C. Tanis$^{1}$ , and Piet Van Mieghem$^{2}$
$^1$
Department of Psychological Methods, University of Amsterdam
d.borsboom@uva.nl
$^2$
Delft University of Technology
Abstract. The imposition of lockdowns in response to the COVID-19
outbreak has underscored the importance of human behavior in
mitigating virus transmission. The scientific study of interventions
designed to change behavior (e.g., to promote physical distancing)
requires measures of effectiveness that are fast, that can be assessed
through experiments, and that can be investigated without actual virus
transmission. This paper presents a methodological approach designed
to deliver such indicators. We show how behavioral data, obtainable
through wearable assessment devices or camera footage, can be used to
assess the effect of interventions in experimental research; in addition,
the approach can be extended to longitudinal data involving contact
tracing apps. Our methodology operates by constructing a contact
network: a representation that encodes which individuals have been in
physical proximity long enough to transmit the virus. Because behavioral
interventions alter the contact network, a comparison of contact networks
before and after the intervention can provide information on the
effectiveness of the intervention. We coin indicators based on this idea
Behavioral Contact Network (BECON) indicators. We examine the
performance of three indicators: the Density BECON, the Spectral
BECON, and the average shortest path length (ASPL) BECON. First,
the Density BECON is based on differences in network density, i.e.,
differences in the portion of realized edges (connections) relative to all
potential edges. Second, the Spectral BECON is based on differences in
the eigenspectrum of the adjacency matrix, which capture the spreading
potential of the virus. Third, the ASPL BECON is based on differences
in the mean of all the shortest distances (i.e., number of edges) between
each pair of nodes in the network, and captures the average distance
between nodes. Using simulations, we show that all three indicators can
effectively track the effect of behavioral interventions. Even in conditions
with significant amounts of noise, BECON indicators can reliably identify
and order effect sizes of interventions. The present paper invites further
study of the method as well as practical implementations to test the
validity of BECON indicators in real data.
Keywords: Contact networks · Network analysis · Epidemiology · Virus
spread · Interventions
1 Introduction
The COVID-19 outbreak has underscored the importance of human behavior in
controlling virus transmission. As long as vaccines are not operational, the only way
to influence transmission rates is through behavioral interventions that either prohibit
specific kinds of behavior (e.g., attending school, visiting relatives, leaving the house)
or promote others (e.g., physical distancing, wearing masks, complying with
regulations). As such, behavior is fundamental to important parameters in
epidemiological models, such as the reproduction number (the number of people a
randomly chosen disease carrier is expected to infect): even though virus transmission
depends on biological characteristics of the virus and the human system, its speed
reflects an interaction between biology and behavior (Delamater, Street,
Leslie, Yang, & Jacobsen, 2019; Heesterbeek et al., 2015). Indeed, one way
of understanding the reasoning behind lockdowns is that they try to drive
down the reproduction number by changing behavioral patterns (de Vlas &
Coffeng, 2021; Jeffrey et al., 2020). The goal of this paper is to contribute to our
understanding of these behavioral patterns, by developing methodological tools that
can be used to study them.
To successfully monitor and control our responses to a virus outbreak like
COVID-19, we need to obtain insight into the relative effectiveness of different
behavioral interventions. Relevant behavioral interventions can either be
implemented at a microlevel (e.g., setting up nudges in a store to promote physical
distancing, changing the floor plan of a restaurant), or a macrolevel (e.g.,
implementing public policy measures that promote working from home, closing public
buildings). Currently, however, methodology for estimating effects of such
interventions at the behavioral level is limited to highly indirect assessments based
on measures of virus spread. For example, comprehensive assessments of
interventions at the macrolevel (Chu et al., 2020) have been estimated based
on the relation between country-level interventions (e.g., school closings,
lockdowns) and corresponding population statistics (e.g., hospital admissions, IC
uptakes, death rates; see for example Flaxman et al., 2020); or they have
been treated as model parameters to assess the time-course of the epidemic
under different scenarios – the well-known study by Ferguson et al. (2020),
which has played an important role in COVID-19-related policy, is a case in
point.
There are at least three methodological reasons why indicators such as hospital
admissions are of limited use in assessing effects of behavioral interventions designed
to counter virus spread. The first problem is that they are lagged indicators.
Evaluating the effect of interventions with hospital admissions as a dependent variable
suffers from the time course of virus transmission, incubation, and disease
progression, before one can assess where the intervention has been effective
(this delay was two to three weeks for COVID-19). The second problem
concerns experimental inaccessibility. If one studies an intervention that is
strongly suspected to be effective, it is unethical to install a control group for
comparison and to wait for participants to become ill. The next best alternative —
a quasi-experimental research setup — suffers from considerable levels of
confounding, and because interventions are almost always implemented in
packages it is hard to disentangle their effects. Third, current indicators
require an active virus. Thus, in a period in which there is no virus active, it is
impossible to study the effects of behavioral interventions. This is strategically
impractical as it would be ideal to study behavioral interventions while the virus is
inactive in order to prepare for a possible future outbreak. Moreover, the
COVID-19 pandemic is unlikely to be the last global pandemic and research in
effective interventions will remain important, even after the current crisis has
ended.
The scientific study of behavioral interventions thus requires indicators that are
fast, that can be assessed through experiments, and that can be investigated without
actual transmission of the virus. In the present paper, we develop a methodological
approach designed to deliver such indicators. In a nutshell, we make use of
the fact that behavioral data, obtainable through wearable devices, camera
data, or tracing apps can be used to assess contact networks (Cencetti et
al., 2020). This can either be done at the microlevel (e.g., assessing contact
patterns at a public gathering) or at the macrolevel (e.g., reconstructing contact
networks at the level of a city on the basis of tracing apps). We coin indicators
based on such networks Behavioral Contact Network (BECON) indicators.
Because BECON indicators are available in real time, they respond to induced
changes in contact networks virtually instantaneously; and because they
do not require actual transmission of the virus, they can be used to assess
effectiveness in healthy subjects, which in turn means they can be studied in
experiments. As such, BECON indicators are suited to make the connection between
epidemiology and behavior, and thereby allow behavioral scientists to leverage
their knowledge and skills in developing optimal interventions to control the
pandemic.
The structure of this paper is as follows. First, we will outline the theoretical basis
of our approach. Second, we discuss the methodological strategy behind
BECON indicators in more detail. Third, we present a simulation study that
serves as a proof of concept. Finally, we discuss future extensions of our
work.
2 Behavioral interventions and the contact network
To understand the relation between behavior and epidemiology, it is important to
introduce an essential mediator in this relation: the contact network. A contact
network encodes which people have been sufficiently close to each other to transmit
the virus (Newman, 2018; Pastor-Satorras, Castellano, Van Mieghem, &
Vespignani, 2015). In contact networks, individuals (or groups of individuals) are
represented as nodes, similar to the representation used in well-known social
networks. Two nodes are connected by a link if the corresponding individuals have
been in sufficiently close prolonged contact for virus transmission to occur, and
disconnected otherwise. Exactly what “sufficiently close” means depends on the virus
in question. For Ebola, which is only transmissible through bodily fluids
(Drazen et al., 2014), a link in the contact network would mean that the
corresponding individuals were in direct physical contact. For SARS-CoV-2, a
link could be present when two individuals have been within a distance of
1 or 2 meters of each other for some time, given its airborne transmission
(CDC, 2020).
Virus spread on a contact network can be conceptualized as a process in which nodes
infect each other via the links in the contact network (Pastor-Satorras et al., 2015).
Usually, a closed population is divided into epidemiological “compartments”:
each individual of the population can be only in one compartment at a time
and the compartments describe stages of the disease. Typical examples of
compartments include S (susceptible), E (exposed), I (infectious), R (removed,
i.e., either cured or deceased) (Keeling & Rohani, 2011). Mathematically,
virus spread is a probabilistic process that operates on the contact network
topology (Grimmett, 2018; Van Mieghem, 2014) and that specifies infection
and curing events, i.e., how long a person is infectious and when the person
is cured or deceased. The time distribution of these events, and the local
rules at the host (i.e., what happens if a person is in state S, E, I, or R),
depend on specifics of the virus in question; for instance, for COVID-19, the
consensus during the SARS-Cov-2 variants operative in 2020 held that people
were infectious for an average of about 6-7 days (Backer, Klinkenberg, &
Wallinga, 2020).
Once the structure of the contact network and the compartment model is
specified, the probability or average fraction of individuals in each compartment can
be computed per unit time (Sahneh, Scoglio, & Van Mieghem, 2013). If the contact
graph does not change too much over time, other global properties of the virus spread
can be determined. An important property is the epidemic threshold, which is
related to the basic reproduction number $R$ (Pastor-Satorras et al., 2015), and
describes the conditions under which outbreaks can occur. If the contact network
changes over time, then we enter a complicated situation in which computer
simulations are necessary to study virus spread. Another approach is to map the
contact graph into a certain class, similar as the classes of Erdős–Rényi or
Barabasi-Albert random graphs, and properties of such a contact graph class can
be deduced, in principle, analogously (Newman, 2018). Thus, we assume
that the time-dependent network has similar properties as the properties
of the class and thus abstract the temporal changes in time. Finally, novel
approaches based on the analysis of time series data can be used to include the
dynamic changes of the network in the analysis (Dekker et al., 2021). In the
current paper, we focus on the simplest case, namely one in which the contact
network is stable over time so that it can be characterized by a single network
structure.
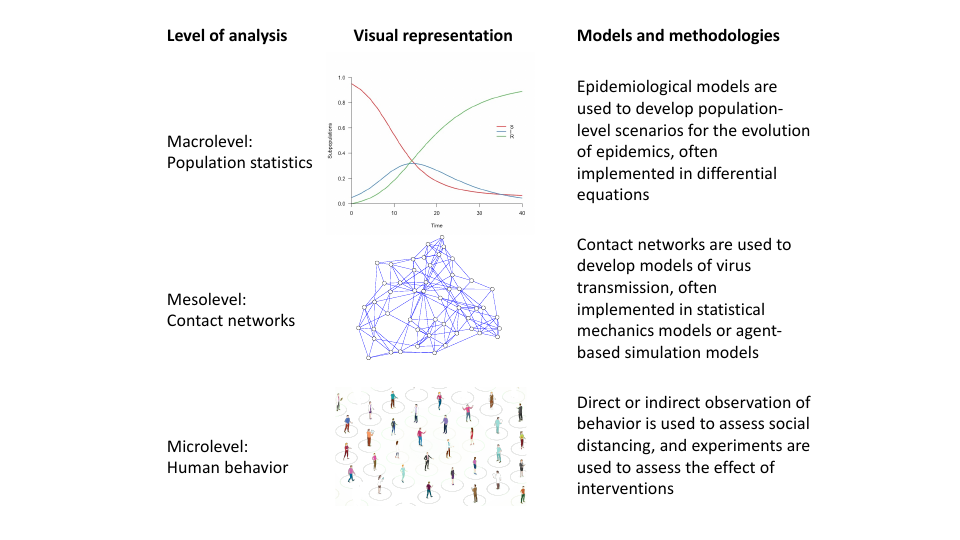
Behavior, contact networks, and compartmental epidemiological models are
strongly related: behavior controls the structure of the contact network, the
contact network directs the spread of the virus, and the spread of the virus
determines population statistics of the epidemiological compartments. Figure 1
represents this hierarchy of levels visually. This has ramifications for how we
should think about behavioral interventions: interventions (e.g., instructing
people to practice physical distancing) lead to behavior change (e.g., people
will keep more distance), which causes contact networks to change (e.g., the
number of links in the network may decrease). These changes cascade into
population level statistics (e.g., the value of $R$ will go down) that eventually
determine policy success (e.g., number of hospital intakes will stay within limits
defined in policy considerations). In accordance, a central idea underlying our
framework is that, in order to connect interventions to epidemiological models,
they should be represented as operations that transform the contact network
(Pastor-Satorras et al., 2015); the present paper applies this idea to behavioral
interventions.
This analysis opens up an important methodological possibility: if behavioral
interventions operate through changes in the contact network, then measures of that
contact network could in principle be used to assess the effect of such interventions.
Such an approach would address each of the problems highlighted in the introduction.
First, assessment of the contact network can be executed instantaneously, addressing
the lagging indicator problem. Second, because the contact network depends only on
whether individuals are sufficiently close to each other, and not on whether they
actually infect each other, we can potentially pick up changes in the contact
network in the absence of actual virus transmission (of course, applications
of insights gained would still require knowledge of how active transmission
works). Third, as a consequence of these two properties, assessments of the
contact network can be implemented in experimental designs without raising
ethical concerns of exposing individuals to virus spread. As a result, the
study of interventions would no longer be limited to assessments of policy
effects at the societal level (Chu et al., 2020; Flaxman et al., 2020) but
could also be used to study manipulations at a much smaller microlevels
(e.g., in specific locations like public buildings, restaurants, or concerts).
Implementation at the microlevel in turn facilitates the type of controlled
experimental research that characterizes psychology (e.g., the implementation
of interventions in factorial designs). In the next paragraph, we show how
contact networks may be assessed to construct indicators that allow for such
approaches.
3 BECON indicator methodology: Strategy and rationale
The idea behind BECON indicators is to assess (functions of) the contact network on
the basis of behavioral observations. In the current paper, we will focus on
assessments of the contact network using wearables or contact tracing apps that are
designed to register whether a person has been within a certain distance (e.g., 1.5
meters) of another person. This methodology has the advantage that it measures a
proxy to actual behavior (rather than, e.g., relying on self-reports) and that it does
not require a controlled environment, so that it can in principle be used in daily life,
enhancing ecological validity.
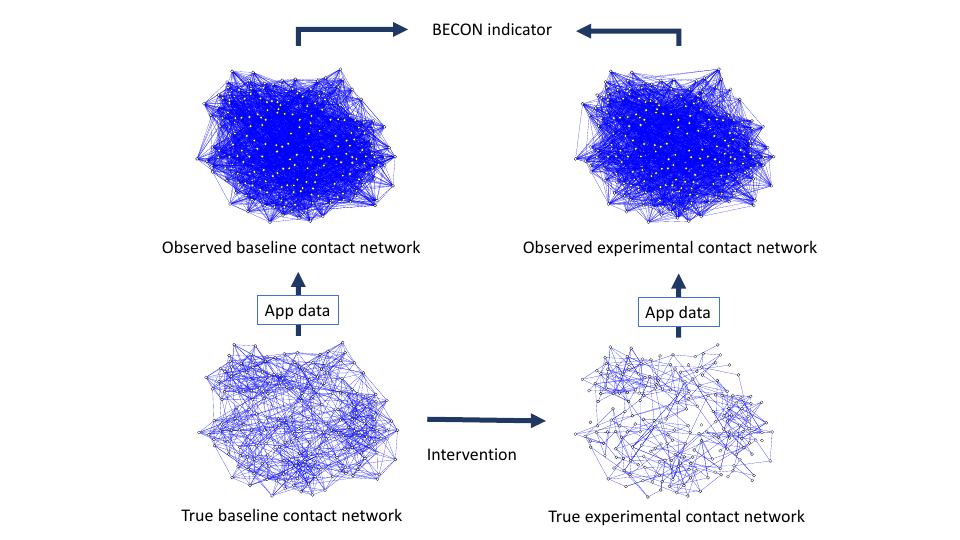
A schematic of the proposed methodology is represented visually in Figure 2. The
interactions between people in the baseline situation (i.e., the situation without the
behavioral intervention of interest being implemented) give rise to the true baseline
contact network (left bottom).
The true contact network is most likely not directly observable. First, as noted,
the presence of a link depends on a theory of virus transmission, which is
approximate. For example, in the case of COVID-19, the presence of aerosol
transmission or infection via surfaces can create links between people who are at a
greater distance than 1.5 meters, or between people who were present at the same
place at distinct time points (e.g., because the aerosols remain present in bathrooms
after the infectious person has left). Second, if the network integrates contacts
over time (e.g., by taking the union of all contact networks at each time
point, which registers during a certain time interval who has ever been in
contact with who, but not when), the representation will contain false positive
connections; for instance, when $A$ and $B$ were in contact, and subsequently $B$
and $C$ were in contact, then the patterns of links suggests that both $A \rightarrow B \rightarrow C$ and $C \rightarrow B \rightarrow A$
are possible infection routes, while only the former route is possible (see
also Dekker et al. (2021)). Third, various kinds of measurement errors can
yield false positives and false negatives. In a situation in which tracking
devices are used, examples of mechanisms that can lead to measurement
errors may include hardware failures, signal failures, and failures in data
processing.
Thus, the true baseline contact network is generally not observable and
difficult to assess adequately. In the present paper we therefore represent this
network as a latent structure. To assess this latent structure, we can use
observations, as for instance obtained through smartphone apps, video footage
analysis, or wearable sensors. For instance, a simple starting point may be
to have a group of people use wearable devices that track their location.
Measured location data may then be used to decide whether two people
have been in contact. Thus, the structure of the data required to construct a
contact network is of the form $[AB, BC, \ldots , YZ]$ which encodes that persons $A$ and $B$, $B$ and $C$,
$\ldots $, and $Y$ and $Z$ have been within 1.5 meters of each other for the amount of
time specified in the definition of a contact. This is called an edge list in
network science, which can be transformed into an adjacency matrix. From
this matrix, many important metrics in network analysis can be computed
(Newman, 2018). We denote the network encoded in the empirically derived
adjacency matrix the observed baseline contact network (top left in Figure
2).
Next, we implement a behavioral intervention. For example, we might instruct
people to keep their distance, put up signposts, install an alarm on their phones that
sounds when they get too close, or use a variety of nudges that promote physical
distancing. If effective, the intervention changes people’s behavior, and as such
induces changes in the contact network. We denote the resulting network as the
true experimental contact network. Like the baseline contact network, the
true experimental contact network is not directly observable, but can be
assessed indirectly through location measurements. Such data may again be
obtained by letting people use wearables in the experimental situation, after
which the results can be used to arrive at an observed experimental contact
network.
Recall that a behavioral intervention effect is, in essence, a transformation of the
contact network. Hence, if we could directly assess the baseline and experimental
contact networks, we could precisely determine the effect of the intervention and,
given a dynamical regime, we could also assess the degree to which the intervention
should be expected to mitigate virus spread. Unfortunately, however, we cannot
directly compare the baseline and experimental networks, as these are only indirectly
observable. However, we can directly compare the observed networks created
through measurements. For example, one could compute the number of links in
the observed experimental contact network, and compare that quantity to
the number of links in the observed baseline network. This way, one could
assess whether, on average, people keep more distance in the experimental
condition. From a bird’s eye perspective, observational studies have shown a
substantial decline in average mobility after lockdowns have been enforced
(e.g., Jeffrey et al., 2020). However, one could also utilize a variety of more
advanced network metrics which can provide a detailed picture of the changes
that the intervention has produced. For example, one could compare the
networks for their density, diameter, average shortest path lengths, etc. to
assess the effect of specifically targeted interventions (e.g., interventions that
target specific individuals central in the contact network, like doctors and
teachers).
The function that is chosen to assess the difference between networks defines a
Behavioral Contact Network indicator; a BECON. In this paper, we develop three
BECONS: The Density BECON, the Spectral BECON, and the ASPL BECON. To
facilitate interpretation, each of the BECON indicators is constructed in such a way
that a higher value on the indicator implies that the experimental network has
changed the network in a direction that would in typical circumstances be expected to
limit the potential for a virus to spread. The indicators studied here are are defined as
follows.
The Density BECON uses the relative change in network density. Network density
is defined as the ratio of the number of links to the total number of possible
links in the network. This measure is epidemiologically relevant, because
denser networks indicate that more people have been in close proximity to
each other. The Density BECON is constructed by dividing the density of
the observed baseline contact network by that of the observed experimental
contact network, where higher values indicate larger experimental effects. In
essence, this measure simply tracks the extent to which the number of contacts
reduces in the experimental condition. This measure would be most relevant in
microlevel applications, where people for instance use wearables during a
public event, because in this case only the direct contacts are relevant. This is
because for COVID-19, a person will take several days from infection to
being infectious; hence, indirect connections that would lead to transfer from
one person to another via a third person ($A \rightarrow B \rightarrow C$) are not possible on such short
time-scales. This metric is particularly suitable in microlevel applications when the
period from infection to being infectious takes multiple days, as was the case
with COVID-19. In this situation, indirect connections that would leads to
transfer from one person to another via a third person ($A \rightarrow B \rightarrow C$) are not possible and,
hence, the (dynamical) contacts can be concatenated into a single contact
network.
The Spectral BECON is based on the spectral radius. The spectral radius is the
largest eigenvalue of the adjacency matrix. The spectral radius is epidemiologically
important, because the inverse of the spectral radius is equal to the so-called
mean-field epidemic threshold, which is in turn a lower bound to the real epidemic
threshold (Van Mieghem & Van de Bovenkamp, 2013; Van Mieghem & van de
Bovenkamp, 2015). The epidemic threshold plays a central role in networks
and copes with structural heterogeneity, because a viral strength above the
epidemic threshold will endemically infect a non-zero fraction of the nodes in
the network. In the limiting case of a complete graph on $N$ nodes, where all
nodes are connected to each other, the epidemic threshold is approximately
equal to $1/N$ and the strength of the virus divided by the epidemic threshold is
approximately equal to the reproduction number, whose critical value is equal
to one (for a reproduction number larger than one, the model predicts the
virus to be endemic, while for values below one it predicts that the virus
will eventually disappear). Moreover, one may control and tune the contact
network so that its spectral radius is minimized and the vulnerability for
infections (virus spread) is maximized (Van Mieghem et al., 2011). The
Spectral BECON is constructed by dividing the largest eigenvalue of the
adjacency matrix of the observed baseline contact network by that of the
observed experimental contact network, such that a larger value indicates a
larger intervention effect. The Spectral BECON would not be relevant in
microlevel research (e.g., tracking people in a location over several hours),
but rather would apply to measures taken over days, as could be gained
using contact tracing apps. A specific example would be contact tracing
within the workspace, where the same group of people met each other over
longer periods of time. Different set-ups and interventions could be tried
out (e.g., different ‘bubbles’ of employees, different organisation of common
spaces, walking routes), and their effectiveness could be assessed using the
Spectral BECON. The Spectral BECON is thus useful to assess intervention
effects that involve changes in the network structure that not only affect the
number of links per node, but work on the architecture of the network as a
whole.
The ASPL BECON uses the average shortest path length (ASPL) between pairs
of nodes in the network. The shortest path length (SPL) between two nodes equals
the minimum number of edges that one has to traverse to travel from one node to the
other; the ASPL is the average value of all SPLs between all pairs of network nodes.
The ASPL is relevant to virus transmission, because the shorter the paths that
connect nodes in a contact network are, the easier the virus can spread from one
person to randomly chosen other person. The ASPL BECON is constructed by
dividing the ASPL of the observed experimental contact network by that of the
observed baseline contact network. Like the Spectral BECON, the ASPL BECON
could be applied in research where contacts are traced over a period of days, in which
indirect connections ($A \rightarrow B \rightarrow C$) are relevant. For calculation of the ASPL BECON we ignore
any infinite shortest path lengths that arise from disconnected graphs (i.e.,
in the case when some nodes or groups of nodes are unconnected). Thus
if there was more than one single connected component (which happened
in less than 3% of the cases), paths between nodes in different connected
components did not exist. We hence ignored these when computing the ASPL
BECON.
The fact that each is expressed as a ratio allows one to interpret the BECON
values directly: for instance, if the Density BECON equals 2, this means that the
density of the observed baseline contact network is twice as large as that of the
observed experimental contact network. Other things being equal, a higher BECON
value would indicate that the intervention would likely be more successful in
mitigating virus spread (naturally, this should be considered in the light of a theory
about the virus transmission process). In research at the microlevel, where
people are traced over periods of hours, the Density BECON would be most
relevant.
An important methodological question is whether we can use BECON indicators
to assess the effect of interventions in realistic circumstances, where our assessments
of the contact network will be distorted in various ways. Thus, the question that
arises is whether the setup sketched in Figure 2 can be used to assess the effect sizes
of experimental manipulations in realistic conditions. For example, can one order the
effects of a set of behavioral interventions in terms of effect size? How does
the methodology fare in the presence of realistic amounts of measurement
error? To assess whether this is indeed possible, we now turn to a simulation
study.
4 Simulation study
The simulation study is designed to evaluate whether the BECON methodology is
indeed able to pick up effects of interventions if these are present. To show this, we
vary the size of intervention effects on the true contact network, and subsequently
assess the corresponding BECON values in the observed contact network which is
subjected to various levels of noise. If the method is reliable, we expect the BECON
values to be higher if the effects are stronger. We evaluate this by computing the
correlation between the size of the simulated intervention effect and the observed
BECON values: the higher the correlation is, the more reliable the BECON is as an
indicator of intervention effects.
In the simulation, we vary the number of nodes in the network $n \in $ [100, 200, 500,
1000], specifying the architecture of the contact network as a small world structure
(Watts & Strogatz, 1998) and generate it using the R package igraph (Csardi &
Nepusz, 2006), with a neighborhood size of $K = 5$ and a rewiring probability of $p = 0.10$. We use
this specification because it leads to a network structure with a high degree of
clustering yet small average shortest path lengths, which is qualitatively similar to the
structure of some social networks found in empirical research, where links may e.g.,
encode whether individuals work at the same place or visit the same sports
club. This network serves as our baseline contact network (Figure 2, left
bottom).
Next, we simulate a measurement process (Figure 2, left arrow). The process
generates imperfect measures of the baseline contact network. We simulated a
measurement function with a false negative rate of $fn = [0.10, 0.20, 0.30]$ (e.g., $fn = 0.30$ implies that only $70\%$ of the
network links were successfully picked up) and false positive rate $fp = [0.10, 0.20, 0.30]$ (e.g., $fp = 0.10$ implies that $10\%$
of the links that are absent in the true contact network will be present in the observed
network). We emphasize that, in the present paper, our interest is not to retrieve the
actual network structure by correcting for these distortions or to recover the
dynamical processes that it supports. Instead, our primary interest here lies in the
pragmatic goal of assessing the effect of interventions, so as to develop an
indicator that can serve to bridge the gap between epidemiology and behavioral
science.
Subsequently, we assess the observed baseline contact network using the obtained
data (Figure 2, top left). This network can be quite severely distorted as a result of
the probabilistic nature of the measurement function. For instance, as is visible in the
figure, the observed network is much denser than the true contact network, even
though the false positive rate is much lower than the false negative rate.
This is because the true contact network is relatively sparse, which means
it contains more absent than present links: the small world networks we
generated for $n = 100$ individuals have $n \times (n - 1) / 2 = 4,950$ possible links, of which on average only $K \times n = 500$ are
actually present. Hence, a false positive rate of $10\%$ generates about $0.10 \times (4,950 - 500) = 445$ false positive
links, while the false negative rate of $30\%$ means that on average only $350$ of the $500$
actual links are successfully identified. In other words, the observed baseline
contact network contains about $445 + 350 = 795$ links, of which only $350$ are true positives.
Because links feature such a low base rate, the probability that two nodes
that are connected in the observed network are actually connected in the
true contact network is only $350/795$, i.e., about $0.44$. This effect is stronger in larger
networks, because in larger networks there are more opportunities for false
positives; for example, in a network of $1000$ individuals, the probability that an
observed link is actually present in the true network is only $0.07$. Thus, the actual
assessment of the network in itself may be largely unsuccessful, especially in larger
networks. We think that similar results would be expected in actual empirical
work if the studied contact networks are sparse. However, as we will see,
the lack of success in assessing the contact network itself does not preclude
the possibility of assessing intervention effects by comparing the observed
networks.
We now implement an intervention on the network (Figure 2, bottom arrow). A
typical intervention would be intended to, e.g., improve physical distancing, and
hence should lead to a lower connectivity in the experimental contact network
(Figure 2, bottom right). We model such an intervention by deleting links
uniformly at random (a process known as bond percolation in the network
literature; Newman, 2018). The proportion of links deleted from the baseline contact
network then defines the effect size of the intervention. We vary this effect size in
steps of $10\%$, from an ineffective intervention, which deletes no links, to the strongest
intervention, which deletes $90\%$ of the links. We implement this intervention in two ways:
the deterministic intervention removes the specified proportion of links exactly, by
randomly deleting links until this proportion is reached, while the probabilistic
intervention removes each link with a probability equal to the specified proportion.
Thus, in an intervention setting with effect size of, say, $0.40$, the deterministic
intervention results in a network where exactly $40\%$ of the links are deleted,
while the probabilistic intervention removes each link with a probability
of $0.40$, so that the expected percentage of removed links equals $40\%$ while each
realization may be different. The probabilistic intervention thus implements a
situation in which the interventions are represented as a random effect that
differs across experimental settings, leading to more uncertainty. Importantly,
these interventions are but two of the many alternative and possibly directed
interventions that one may study (Trajanovski, Martín-Hernández, Winterbach, &
Van Mieghem, 2013).
Finally, we implement the same measurement function as before on the
experimental contact network. This way, we arrive at the observed experimental
network (Figure 2, top right). As was the case for the baseline contact network,
this assessment is dominated by false positives, which leads to a significant
overestimation of the network density. In addition, the fact that the experimental
contact network is sparser than the baseline contact network implies that
the probability of a link being present in the experimental network, given
that it is present in the observed experimental network, has diminished even
more.
Table 1: Simulation results across conditions for a small world graph. The table
reports correlations (means and sd) between BECONs and intervention effect
sizes for deterministic and probabilistic interventions across simulation runs for
multiple network sizes. The results are averaged over the false negative rates.
| $n$ | FP | Deterministic | | Probabilistic
|
| | |
| |
|
| | | Density | Spectral | ASPL | | Density | Spectral | ASPL
|
| | |
| |
|
| | | $r$ | $SD$ | $r$ | $SD$ | $r$ | $SD$ | | $r$ | $SD$ | $r$ | $SD$ | $r$ | $SD$
|
| 100 | 0.1 | 1 | 0 | 1 | 0 | 1 | 0 | | 0.97 | 0.03 | 0.96 | 0.04 | 0.97 | 0.03 |
| 100 | 0.2 | 1 | 0 | 1 | 0 | 1 | 0 | | 0.92 | 0.05 | 0.92 | 0.06 | 0.92 | 0.05 |
| 100 | 0.3 | 1 | 0 | 1 | 0 | 1 | 0 | | 0.86 | 0.10 | 0.86 | 0.10 | 0.85 | 0.11 |
| 200 | 0.1 | 1 | 0 | 1 | 0 | 1 | 0 | | 0.97 | 0.03 | 0.96 | 0.03 | 0.97 | 0.02 |
| 200 | 0.2 | 1 | 0 | 1 | 0 | 1 | 0 | | 0.92 | 0.06 | 0.91 | 0.06 | 0.91 | 0.06 |
| 200 | 0.3 | 1 | 0 | 1 | 0 | 1 | 0 | | 0.86 | 0.10 | 0.85 | 0.10 | 0.85 | 0.11 |
| 500 | 0.1 | 1 | 0 | 1 | 0 | 1 | 0 | | 0.96 | 0.03 | 0.96 | 0.03 | 0.97 | 0.02 |
| 500 | 0.2 | 1 | 0 | 1 | 0 | 1 | 0 | | 0.92 | 0.07 | 0.92 | 0.06 | 0.91 | 0.07 |
| 500 | 0.3 | 1 | 0 | 1 | 0 | 1 | 0 | | 0.85 | 0.11 | 0.84 | 0.11 | 0.84 | 0.11 |
| 1000 | 0.1 | 1 | 0 | 1 | 0 | 1 | 0 | | 0.96 | 0.03 | 0.96 | 0.03 | 0.96 | 0.03 |
| 1000 | 0.2 | 1 | 0 | 1 | 0 | 1 | 0 | | 0.91 | 0.06 | 0.91 | 0.06 | 0.91 | 0.06 |
| 1000 | 0.3 | 1 | 0 | 1 | 0 | 1 | 0 | | 0.85 | 0.10 | 0.85 | 0.10 | 0.85 | 0.10 |
| |
As a measure of the accuracy of the BECONs in ordering the intervention effect
sizes, we compute the average correlation between the estimated BECONs and the
actual intervention effect across simulation runs. A correlation of unity then means
that the BECONs order the interventions perfectly, while a correlation of $0$ means that
the BECONs do no better than chance.
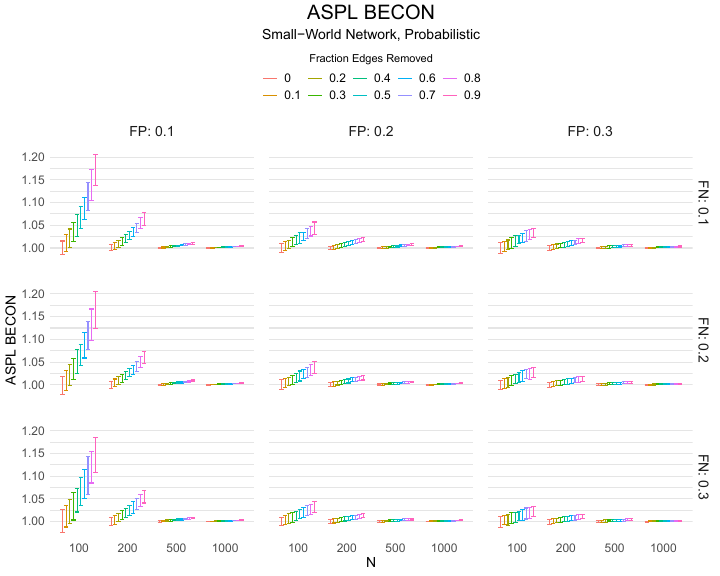
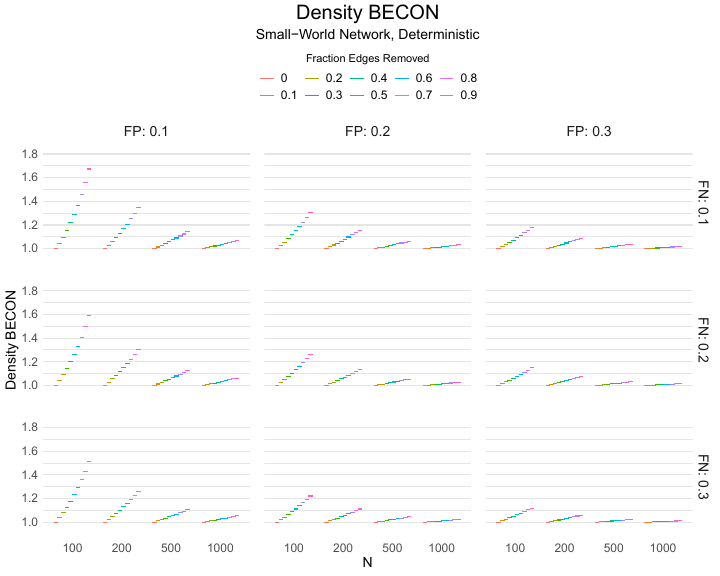
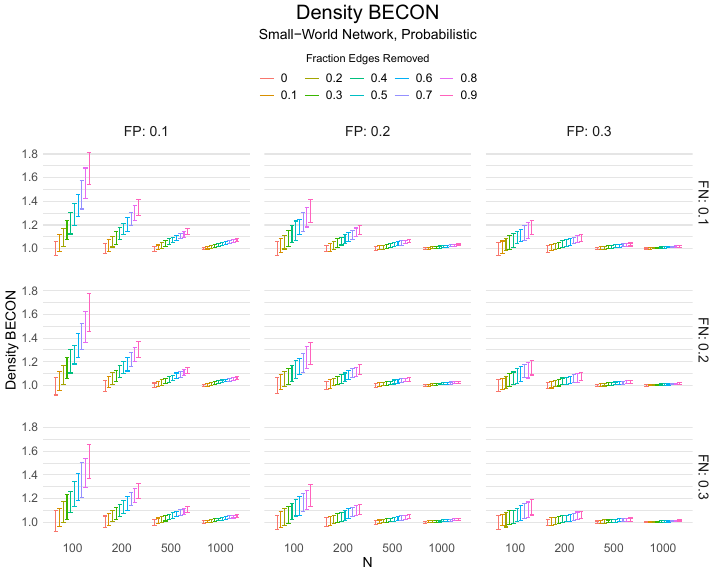
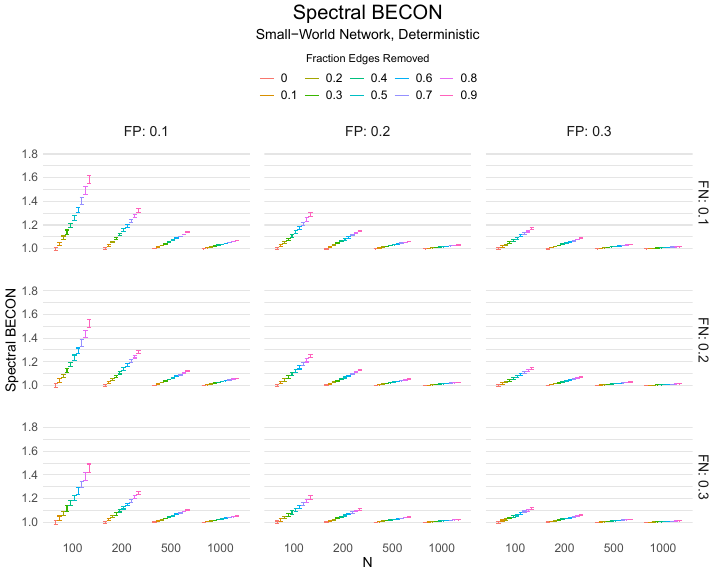
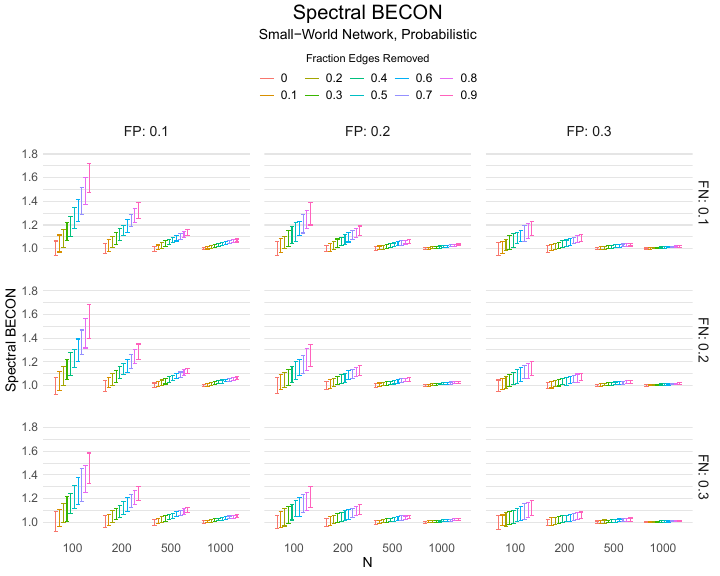
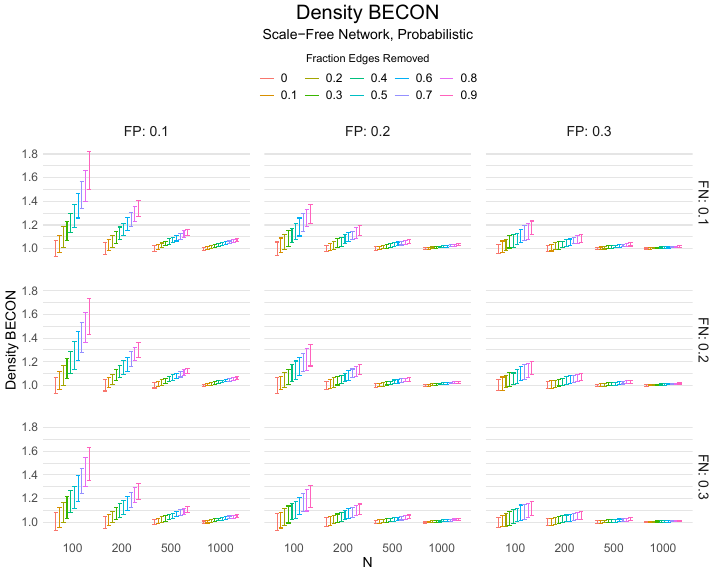
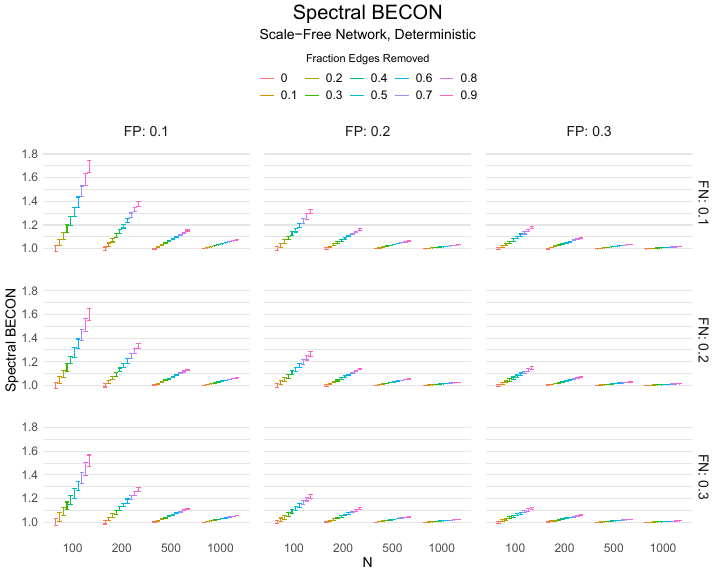
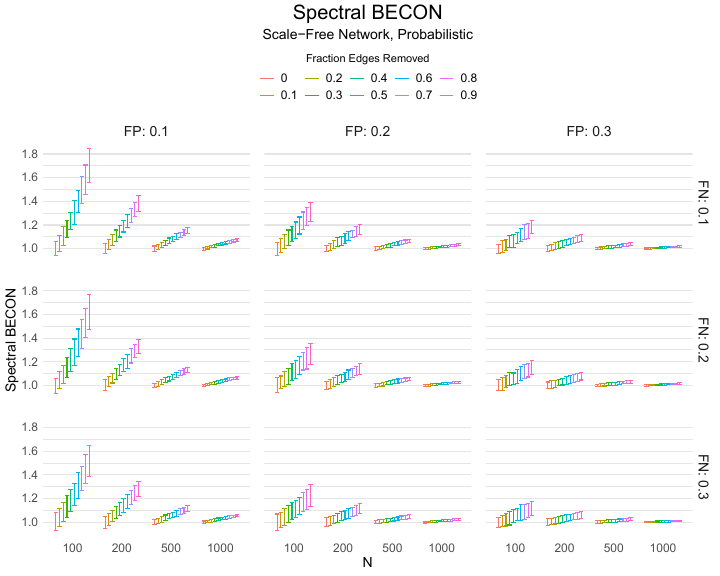
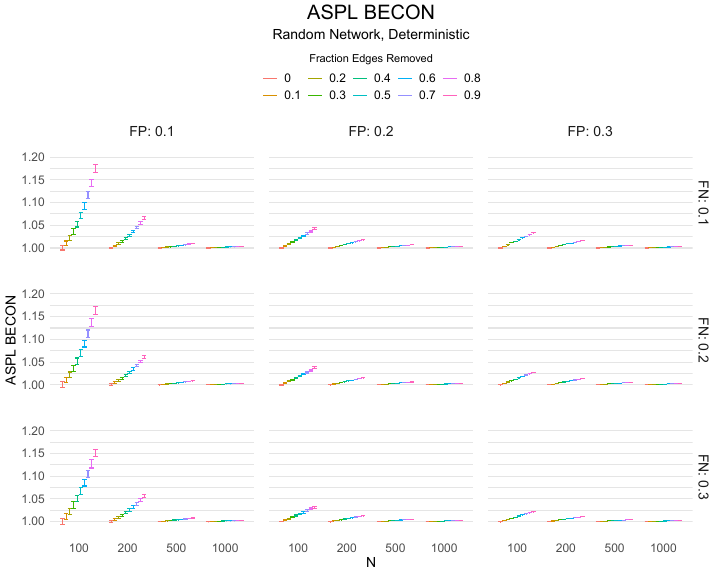
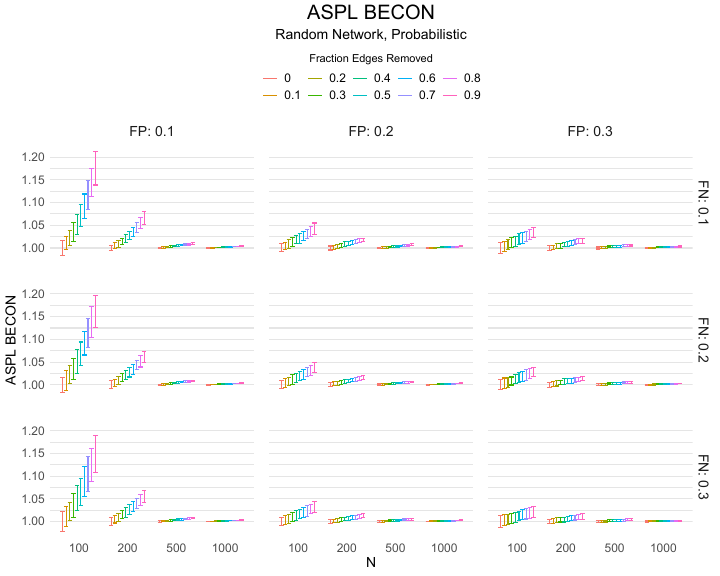
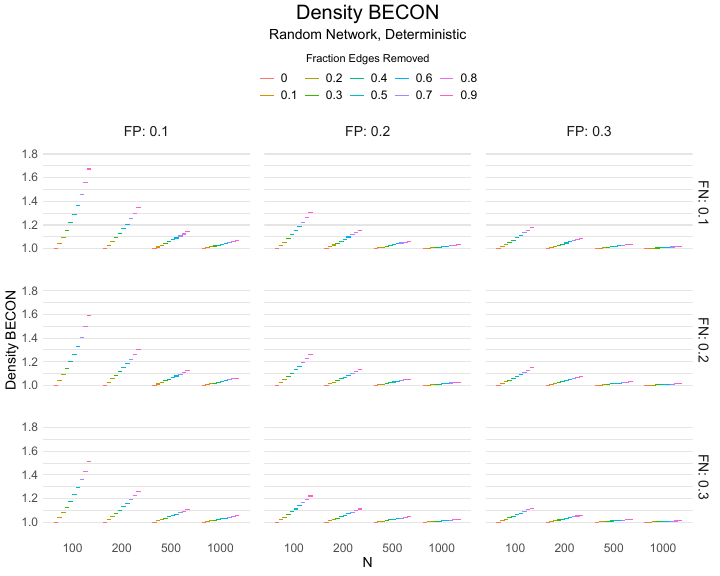
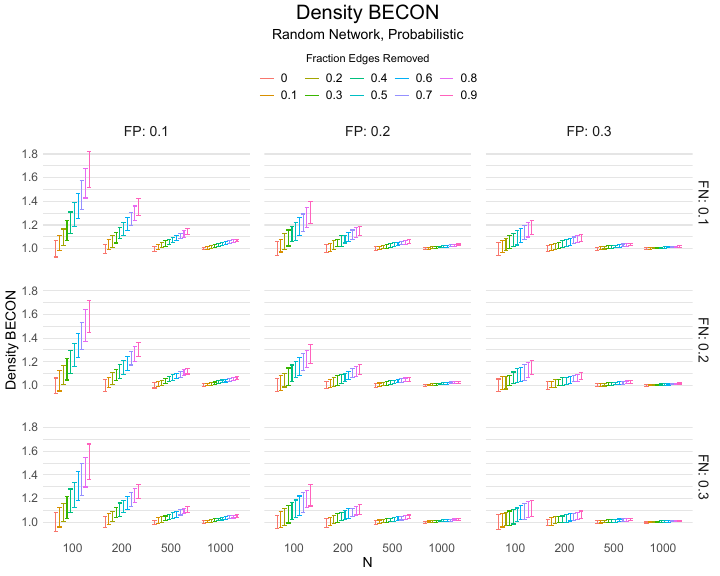
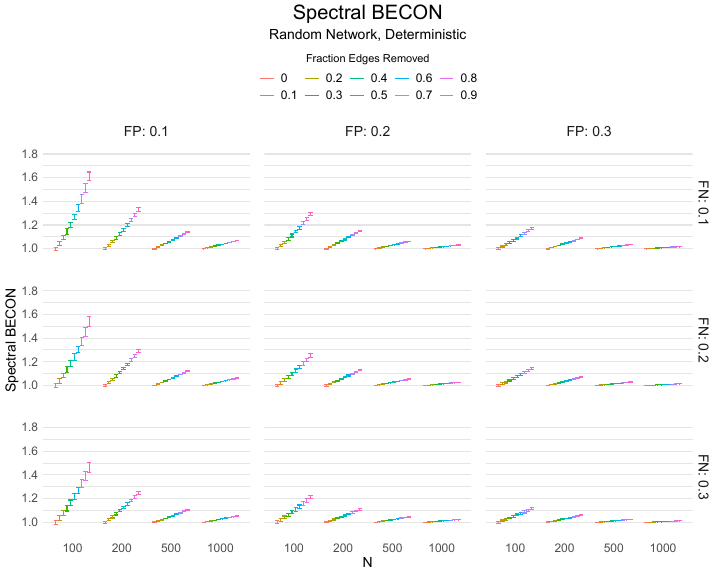
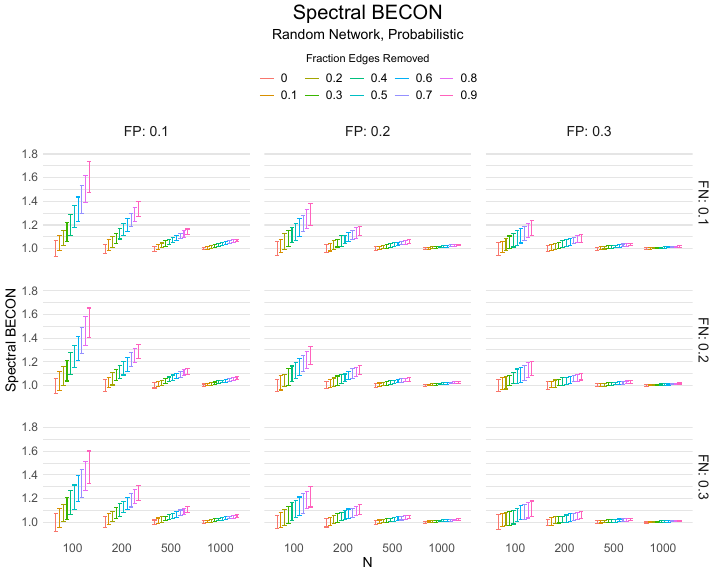
Results of the simulations are given in Table 1. As can be seen from the table,
despite the fact that the networks used to compute the BECONs were poor
representations of the actual contact networks, the difference between the
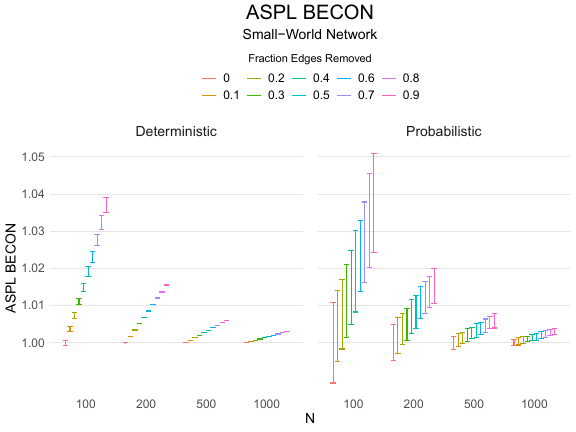
observed networks tracks the intervention effect size reliably. To illustrate how
these effects arise, Figure 3 gives a detailed representation of results for one
specific BECON in the simulation design, i.e., the ASPL BECON performance
with $fp = 0.20$ and $fn = 0.20$. Detailed representations of simulation results for all BECONs
across all conditions are given in the Appendix. As shown in detail in the
Appendix, the results in Figure 3 are representative of the behavior of all three
BECONs, which uniformly varied as a monotonic function of effect size, in
the sense that the probability distributions of these statistics stochastically
order the interventions. The separation of effect sizes is in fact perfect for all
deterministic intervention simulations. In the probabilistic intervention simulation,
results are somewhat more attenuated, but the correlation between true and
estimated intervention effects does not drop below $0.80$. Thus, even with sizeable
false positive and false negative rates, the methodology still works extremely
well.
As can be seen in Figure 3 and the extended results in the Appendix,
BECONs are monotonically related to intervention effect sizes, such that stronger
effects result in higher BECONs. Yet, for larger networks, the increase in
BECON attenuates (i.e., the slope becomes smaller). This can be explained
by the small world structure of the networks, which makes larger networks
relatively more sparse compared with smaller networks. As a result, a fixed
false positive rate in the measurement process (e.g., $20\%$ false positives) has a
more pronounced effect in the larger networks. This is because the number of
present links grows linearly with the number of nodes, while the number of
possible links grows quadratically, and therefore larger networks feature a
smaller percentage of present links. For example, a neighborhood size of $5$
results in the presence of about $1\%$ of the possible links in a network of $1000$ people ($5,000$
out of $449,500$), but the presence of about $10\%$ of the possible links in a network of $100$
people ($500$ out of $9,900$). As this measurement process applies to both the observed
baseline network and to the observed experimental network, the false positive
rate will make larger networks relatively more similar to each other than
smaller networks. Consequently, it is more difficult to detect an effect in larger
networks, which is reflected in the BECONs. However, as is evident from Table
1, BECON performance is robust against this effect across the conditions
simulated.
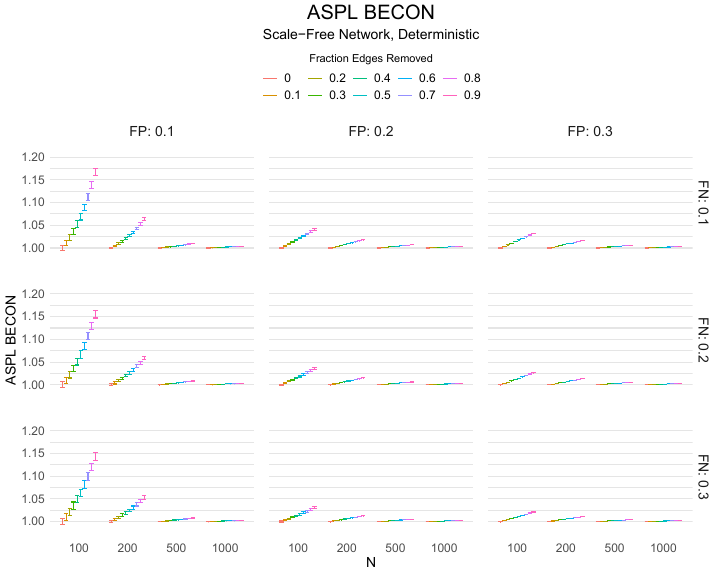
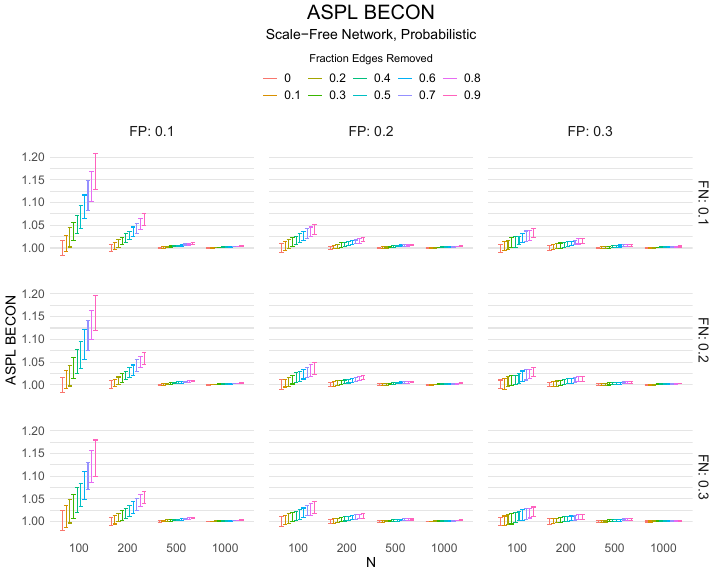
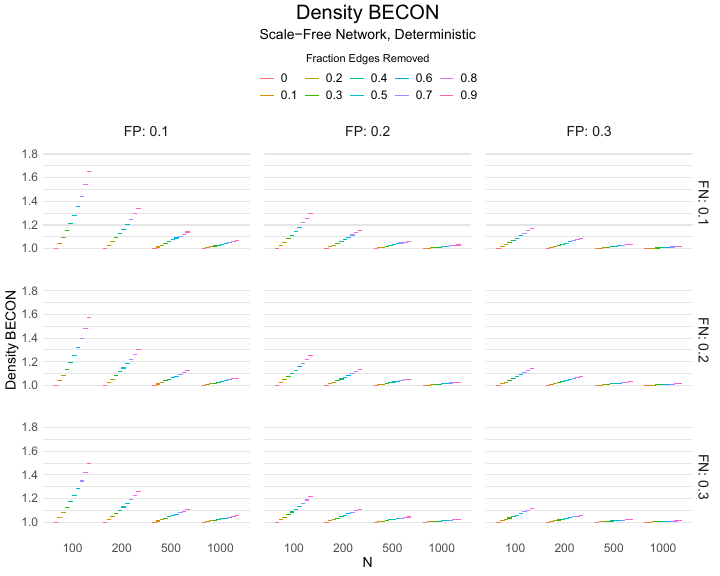
Finally, we find essentially the same results for a scale-free network, that is, a
network whose degree distribution follows a power law, and for an Erdős–Rényi
random graph, which has a binomial degree distribution. Results for these
network structures as well as code to reproduce them are available at
https://gitlab.com/science-versus-corona/becon. Performance is broadly
consistent across network structures. The reason for this may lie in the noisy
measurement process: the false positive rate results in a substantial amount of new
links, which obscure the original structure and thereby may counter effects of network
structure.
5 Discussion
In this paper, we have introduced a behavioral data science methodology to study
interventions designed to counter virus spread, and have shown in simulations
that this methodology is both feasible and effective. BECON indicators,
constructed to pick up changes in the contact network that are induced by
interventions, were shown to track intervention effects reliably under realistic
measurement conditions that are characterized by substantial levels of noise. Thus,
BECON indicators offer a promising methodological approach to studying
interventions designed to mitigate virus spread in COVID-19 and other infectious
diseases.
Because BECON indicators are instantaneous and can be constructed in the
absence of actual virus spread, they address the main problems that plague widely
used indicators, such as hospital admissions and death rates. In contrast to current
indicators, BECON indicators do not suffer from lags and can be used in
experimental designs; in addition, if used in the absence of actual virus transmission,
the use of BECON indicators need not put participants in control conditions at risk.
Therefore, BECON indicators have the important advantage that they can be used
when viruses are not present, i.e., they allow us to maximize our defenses and
to prepare for new outbreaks. Of course, the interpretation of the results
does depend on details of the virus transmission process, and an important
question is how to relate changes in the observed contact networks to this
process.
As indicated, the study of which BECON is best suited for a given research
question depends on a combination of factors including characteristics of the virus,
properties of the research design, and the goals of the research program. One
important issue, highlighted throughout this manuscript, involves the time scale at
which the research program runs in relation to the time scale at which a virus
spreads. In cases where people are observed for a shorter time than that needed for
the virus to incubate and become infectious, the Density BECON is always best,
because the virus cannot travel more than a single step in the network. In cases where
people are followed for a period that exceeds this period, the Spectral and ASPL
BECONs become feasible alternatives. If one wants to study effects of generic
interventions (e.g., lockdowns or school closures) on virus spreading potential,
then the Spectral BECON is indicated due its close relation to the epidemic
threshold (Van Mieghem & Van de Bovenkamp, 2013; Van Mieghem & van de
Bovenkamp, 2015). Finally, in cases where one has interventions that are specifically
targeted at the path lengths in the network (e.g., interventions targeted to limit
interactions based on a previous interaction history), one can use the ASPL
BECON. Thus, generally, we would recommend the Density BECON in all
situations where the research design observes behavior at a duration below
that needed for the virus to spread, and the Spectral and ASPL BECONs
in research designs that observe behavior for longer durations; the choice
between Spectral and ASPL BECONs then depends on specifics of the research
question.
The Density BECON offers a simple metric to be used in small scale experiments,
where one for instance wants to test the effectiveness of office designs in a company,
or where one desires to assess the relative effect of different nudges. We performed a
study in which we applied the BECON methodology in practice. During an art fair,
we implemented different nudges and evaluated its effect on the contact network. This
way we could for example show that walking directions positively impacted physical
distancing and reduced the number of contacts, demonstrating the effectiveness of the
proposed methodology in practice (Blanken et al., 2021; Tanis et al., 2021).
Simulations indicate that even for small networks the indicators are reliable.
However, BECON indicators are potentially also applicable to large scale
research. For example, using contact tracing apps, it should be possible to assess
contact networks at the scale of neighborhoods, cities, or even countries. Thus,
BECON indicators could be implemented in a dashboard used by policy
makers to assess the degree to which current policies are on track. Because
they are much faster than traditional indicators, they may also be highly
useful in contributing to alarm systems that indicate that policy action is
required.
While our approach aims to change the network structure by deleting
links, a closely related notion is the removal of nodes (known as site
percolation; Newman, 2018). This is especially important in vaccination
campaigns, especially if vaccinating an individual leads to a situation where
the vaccinated individual cannot receive nor spread the disease (Y. Liu et
al., 2021).
Strictly speaking, vaccinating an individual does not change the network structure.
For the purposes of disease spreading, however, one may reformulate it as such: in
cases where vaccinating an individual ensure that the individual will no longer be able
to spread the disease, this implies that all links going into and out of the node will be
removed. Although it focuses on node rather than link removal, research done on
animal populations is related to the approach we propose here. Carne, Semple,
Morrogh-Bernard, Zuberbuehler, and Lehmann (2013), for example, use simulations
to study how targeted vaccination (e.g., vaccinate the most central nodes) outperform
random vaccination in a network derived from observations of orangutans and
chimpanzee populations, respectively. They used cluster size and shortest
paths of the network as measures to assess the effect of interventions (see
also Albert, Jeong, & Barabási, 2000). Relating the network structure to the final
outbreak size, Rushmore et al. (2014) find in simulations that vaccinating
the most connected chimpanzees can reduce the outbreak size considerably.
While these articles focus on node removal, we expect that our approach
can learn from such approaches; future research may explore this line more
fully.
Several limitations to the present work should be noted. For example, as we have
emphasized throughout this paper, observed networks will ordinarily be poor
representations of the contact networks of interest unless contact network assessments
are augmented by more advanced measurement methods. Therefore, one
should be very careful in using observed contact networks as proxies for the
underlying contact networks. For example, the fact that observed networks are
likely to be much more dense than the underlying contact networks suggests
that it would not be a good idea to use these observed networks naively in,
e.g., simulations of virus transmission. However, our primary interest in this
paper was not in the reconstruction of contact networks per se, but in the
comparison of contact networks across experimental conditions. Standard
experimental wisdom holds that errors in observations need not form an
insurmountable problem as long as the structure and size of the induced
distortions is comparable across experimental conditions; in this case, systematic
errors will be invariant across conditions, and random errors will average out
as the number of observations grows. This indeed is shown to be the case
in our simulations. It should be noted that more advanced reconstruction
methods may lead to biases if they are differentially effective across conditions,
so a better reconstruction need not imply a better signal of intervention
effectiveness.
Our approach invites improvements at several points. First, we study a simple
measurement process. In the real world, it is likely that the observed network is not
biased in a manner as we study here (i.e., by adding false positives and false
negatives), but that more complicated biases occur as would, for example, arise when
the structure of missing data depends on the network structure itself. Such
biases can be addressed by adding an intermediary network reconstruction
step. In particular, before computing the BECONs, one can use network
reconstruction algorithms to first arrive at a better representation of the true
network (e.g., Clauset, Moore, & Newman, 2008; Ghasemian, Hosseinmardi,
Galstyan, Airoldi, & Clauset, 2020; Goyal & Ferrara, 2018; Guimerà &
Sales-Pardo, 2009). Similarly, the use of additional sources of information deliverable
through mobile phones (e.g., geographical location data, WIFI data, ultra
wide-band technology) could enhance the precision of the signal (Trofimenko,
Mukhina, & Visheratin, 2016). In addition, if the amount of bias in the
measurement function is not equal across experimental conditions, the presented
methodology would likely lead to incorrect conclusions. Because of the sparsity of
the contact networks, even differences in random noise could potentially
lead to bias in the effect sizes under certain conditions. For example, if the
experimental intervention increases the percentage of false negatives, it can seem
effective while it is not. Statistical corrections could be developed on the
basis of latent variable models, which are able to accommodate violations of
measurement invariance to some extent (Meredith, 1993; Van De Schoot et
al., 2013).
Another open question is whether the validity of BECONs is symmetric; can we
pick up interventions that make the network more densely connected as easily as
interventions that prune it? This is an important question in the process of
monitoring lifting regulations, which is expected to create increasingly connected
contact networks. BECON methodology could be used to assess the relative risk of
different lifting interventions experimentally, and as such may inform exit
strategies.
Given that the value of the BECON methodology especially lies in its ability to
tap into actual (distancing) behavior, we hope the present paper contributes to
experimental research into the effectiveness of behavioral interventions in this domain.
However, the interventions we have studied in this paper are very simple, as they
delete links at random. One may interpret such an intervention as reducing contacts
at random. It would be interesting to investigate what happens if an intervention does
not randomly delete links, but affects the structure of the network in a different
way (as for example in Trajanovski et al., 2013). For example, one could
examine what happens if interventions selectively take out shortest paths, but
keep clusters (e.g., groups of friends) intact. This would probably change
not only the density, but also the structure of the contact network after
intervention; for example, selectively targeting nodes with high centrality
may lead the network to lose its small world character. These interventions
would have considerable effect on epidemic spread. One such investigation was
recently provided by Block et al. (2020). The authors study three types of
interventions — limiting social interactions to a few individuals, seeking
similarity across contacts, and strengthening communities — that change the
contact network. They subsequently simulate virus spread and find that all
three interventions substantially flatten the infection curve compared to no
intervention, as well as to an intervention that makes actors randomly reduce their
contacts (i.e., removes links at random). As suggested above, this shows
that more thoughtful interventions can have a more drastic effect on virus
transmission. Since different interventions change the contact network in
different ways, it is important to choose the right BECON. In addition, such
thought experiments suggest that the question under which conditions which
BECONs can adequately track virus transmission is open for future research; one
could imagine, for instance, implementing different interventions and running
epidemiological virus spread models on the resulting networks to understand how
different interventions change the epidemiological course of the virus. Finally,
the current setup ignores dynamical information about interventions (e.g.,
the duration of effects), and extending measurements and models in this
direction could augment the signal considerably (Dekker et al., 2021). Such
information could then be used to assess these interventions in a more precise
fashion.
Not all interventions are amenable to the BECON approach. For instance, certain
interventions may be highly effective in controlling the virus spread without
implementing large changes in the network. A salient example arises when interventions
are directed at interrupting processes that run on specific parts of the contact
network, rather than at changing the network structure globally. Such interruptions
are, for instance, the goal of contact tracing (Cencetti et al., 2020; Kojaku,
Hébert-Dufresne, Mones, Lehmann, & Ahn, 2021; Kretzschmar et al., 2020).
Interventions based on contact tracing provide highly local and surgical interventions
on the network (namely, by isolating potentially infected cases, such procedures delete
the corresponding links from the contact network). It is unlikely that global measures
like BECONs would be able to pick up such subtle effects, especially if cases are
rare so that relatively few links are deleted. Also, it would be important to
study whether contact tracing interventions invariably lead to structures that
diminish the potential for virus transmission; one can imagine situations where
alarm systems based on contact tracing may instigate behavior that increases
virus transmission. This would especially be relevant if alarm systems are
unreliable or are activated too late, which underscores the importance of accurate
prediction.
In the future, network theory may assist behavioral scientists in developing
novel interventions. For example, if advanced reconstruction of the contact
network to a high level of precision becomes feasible, interventions could be
shaped by the analysis of the baseline network itself. In such an approach,
one could first analyze the baseline contact network, and then explicitly
design interventions to target particular aspects of the contact network to
induce maximal change, analogous to the use of targeted vaccinations in
epidemiology (Q. Liu, Zhou, & Van Mieghem, 2019; Pastor-Satorras &
Vespignani, 2002). Similarly, interventions could be explicitly targeted to decrease
the spectral radius of the contact network (Van Mieghem et al., 2011),
because this controls the potential for outbreaks (Van Mieghem & Van de
Bovenkamp, 2013; Van Mieghem & van de Bovenkamp, 2015). In accordance,
targeted evaluations of changes in the contact network after intervention could be
used to assess whether the intended changes have indeed been accomplished. This
approach potentially defines an extensive research program, in which behavioral data
scientists, epidemiologists, psychologists, computer scientists, and statisticians
could profitably work together to construct, implement, and monitor optimal
interventions.
References
Albert, R., Jeong, H., & Barabási, A.-L. (2000). Error and attack
tolerance of complex networks. Nature, 406(6794), 378–382. doi:
https://doi.org/10.1038/35019019
Backer, J. A., Klinkenberg, D., & Wallinga, J. (2020). Incubation period of 2019
novel coronavirus (2019- nCoV) infections among travellers from Wuhan,
China, 20 28 January 2020. Eurosurveillance, 25(5), 1–6. Retrieved
from http://dx.doi.org/10.2807/1560-7917.ES.2020.25.5.2000062 doi:
https://doi.org/10.2807/1560-7917.ES.2020.25.5.2000062
Blanken, T. F., Tanis, C. C., Nauta, F. H., Dablander, F., Zijlstra,
B. J. H., Bouten, R. R. M., … Borsboom, D. (2021). Promoting
physical distancing during COVID-19: a systematic approach to
compare behavioral interventions. Scientific Reports, 11(1), 19463.
Retrieved from https://doi.org/10.1038/s41598-021-98964-z doi:
https://doi.org/10.1038/s41598-021-98964-z
Block, P., Hoffman, M., Raabe, I. J., Dowd, J. B., Rahal, C., Kashyap, R., &
Mills, M. C. (2020). Social network-based distancing strategies to flatten the
covid-19 curve in a post-lockdown world. Nature Human Behaviour, 1–9. doi:
https://doi.org/10.1038/s41562-020-0898-6
Carne, C., Semple, S., Morrogh-Bernard, H., Zuberbuehler, K., & Lehmann, J.
(2013). Predicting the vulnerability of great apes to disease: the role of
superspreaders and their potential vaccination. PLoS One, 8(12), e84642. doi:
https://doi.org/10.1371/journal.pone.0084642
CDC. (2020). How COVID-19 spreads. Retrieved 2021-07-14,
from https://www.cdc.gov/coronavirus/2019-ncov/prevent-getting-sick/how-covid-spreads.html
(Accessed on 28-09-2021)
Cencetti, G., Santin, G., Longa, A., Pigani, E., Barrat, A., Cattuto, C., … Lepri,
B. (2020). Using real-world contact networks to quantify the effectiveness of
digital contact tracing and isolation strategies for Covid-19 pandemic.
medRxiv.
Chu, D. K., Akl, E. A., Duda, S., Solo, K., Yaacoub, S., Schünemann, H. J., …
others (2020). Physical distancing, face masks, and eye protection to prevent
person-to-person transmission of SARS-CoV-2 and COVID-19: a systematic
review and meta-analysis. The Lancet, 395(10242), 1973–1987. doi:
https://doi.org/10.1016/j.jvs.2020.07.040
Clauset, A., Moore, C., & Newman, M. E. (2008). Hierarchical structure and the
prediction of missing links in networks. Nature, 453(7191), 98–101. doi:
https://doi.org/10.1038/nature06830
Csardi, G., & Nepusz, T. (2006). The igraph software package for complex
network research. InterJournal, Complex Systems, 1695(5), 1–9.
Dekker, M. M., Blanken, T. F., Dablander, F., Ou, J., Borsboom,
D., & Panja, D. (2021). Quantifying agent impacts on contact
sequences in social interactions. arXiv preprint arXiv:2107.01443. doi:
https://doi.org/10.1038/s41598-022-07384-0
Delamater, P. L., Street, E. J., Leslie, T. F., Yang, Y. T., & Jacobsen, K. H.
(2019). Complexity of the basic reproduction number ($R_0$). Emerging infectious
diseases, 25(1), 1.
de Vlas, S. J., & Coffeng, L. E. (2021). Achieving herd immunity against covid-19
at the country level by the exit strategy of a phased lift of control. Scientific
Reports, 11(1), 1–7. doi: https://doi.org/10.1038/s41598-021-83492-7
Drazen, J., Kanapathipillai, R., Campion, E., Rubin, E., Hammer, S., Morrissey,
S., & Baden, L. (2014). Ebola and quarantine. The New England Journal of
Medicine, 371(21), 2029–2030. doi: https://doi.org/10.1056/nejme1413139
Eyre, D. W., Taylor, D., Purver, M., Chapman, D., Fowler, T., Pouwels, K. B., …
Peto, T. E. (2022). Effect of covid-19 vaccination on transmission of
alpha and delta variants. New England Journal of Medicine, 386(8),
744-756. Retrieved from https://doi.org/10.1056/NEJMoa2116597 doi:
https://doi.org/10.1056/NEJMoa2116597
Ferguson, N., Laydon, D., Nedjati-Gilani, G., Imai, N., Ainslie, K., Baguelin, M.,
… others (2020). Report 9: Impact of non-pharmaceutical interventions (NPIs)
to reduce COVID19 mortality and healthcare demand. Imperial College
London, 10(77482), 491–497.
Flaxman, S., Mishra, S., Gandy, A., Unwin, H. J. T., Mellan, T. A., Coupland,
H., … others (2020). Estimating the effects of non-pharmaceutical
interventions on COVID-19 in Europe. Nature, 584(7820), 257–261. doi:
https://doi.org/10.1038/s41586-020-2405-7
Ghasemian, A., Hosseinmardi, H., Galstyan, A., Airoldi, E. M., & Clauset, A.
(2020). Stacking models for nearly optimal link prediction in complex networks.
Proceedings of the National Academy of Sciences, 117(38), 23393–23400. doi:
https://doi.org/10.1073/pnas.1914950117
Goyal, P., & Ferrara, E. (2018). Graph embedding techniques, applications, and
performance: A survey. Knowledge-Based Systems, 151, 78–94. doi:
https://doi.org/10.1016/j.knosys.2018.03.022
Grimmett, G. (2018). Probability on graphs: random processes on
graphs and lattices (Vol. 8). Cambridge University Press. doi:
https://doi.org/10.1017/9781108528986
Guimerà, R., & Sales-Pardo, M. (2009). Missing and spurious interactions and
the reconstruction of complex networks. Proceedings of the National Academy of
Sciences, 106(52), 22073–22078. doi: https://doi.org/10.1073/pnas.0908366106
Heesterbeek, H., Anderson, R. M., Andreasen, V., Bansal, S., De Angelis,
D., Dye, C., … others (2015). Modeling infectious disease dynamics
in the complex landscape of global health. Science, 347(6227). doi:
https://doi.org/10.1126/science.aaa4339
Jeffrey, B., Walters, C. E., Ainslie, K. E., Eales, O., Ciavarella, C., Bhatia, S., …
others (2020). Anonymised and aggregated crowd level mobility data from
mobile phones suggests that initial compliance with COVID-19 social distancing
interventions was high and geographically consistent across the UK. Wellcome
Open Research, 5. doi: https://doi.org/10.12688/wellcomeopenres.15997.1
Keeling, M. J., & Rohani, P. (2011). Modeling infectious diseases in humans and
animals. Princeton University Press. doi: https://doi.org/10.2307/j.ctvcm4gk0
Kojaku, S., Hébert-Dufresne, L., Mones, E., Lehmann, S., & Ahn, Y.-Y. (2021).
The effectiveness of backward contact tracing in networks. Nature Physics,
17(5), 652–658. doi: https://doi.org/10.1038/s41567-021-01187-2
Kretzschmar, M. E., Rozhnova, G., Bootsma, M. C., van Boven, M., van de
Wijgert, J. H., & Bonten, M. J. (2020). Impact of delays on effectiveness of
contact tracing strategies for COVID-19: a modelling study. The Lancet Public
Health, 5(8), e452–e459. doi: https://doi.org/10.1016/s2468-2667(20)30157-2
Liu, Q., Zhou, X., & Van Mieghem, P. (2019). Pulse strategy for suppressing
spreading on networks. Europhysics Letters, 127(3), 38001. doi:
https://doi.org/10.1209/0295-5075/127/38001
Liu, Y., Sanhedrai, H., Dong, G., Shekhtman, L. M., Wang, F., Buldyrev,
S. V., & Havlin, S. (2021). Efficient network immunization under limited
knowledge. National Science Review, 8(1), nwaa229.
Meredith, W. (1993). Measurement invariance, factor analysis and factorial invariance.
Psychometrika, 58(4), 525–543. doi: https://doi.org/10.1007/bf02294825
Newman, M. (2018). Networks. Oxford university press. doi:
https://doi.org/10.1093/oso/9780198805090.001.0001
Pastor-Satorras, R., Castellano, C., Van Mieghem, P., & Vespignani, A. (2015).
Epidemic processes in complex networks. Reviews of Modern Physics, 87(3),
925–979. doi: https://doi.org/10.1103/revmodphys.87.925
Pastor-Satorras, R., & Vespignani, A. (2002). Immunization of complex networks.
Physical review E, 65(3), 036104. doi: https://doi.org/10.1103/physreve.65.036104
Rushmore, J., Caillaud, D., Hall, R. J., Stumpf, R. M., Meyers, L. A., & Altizer,
S. (2014). Network-based vaccination improves prospects for disease control in
wild chimpanzees. Journal of the Royal Society Interface, 11(97), 20140349.
doi: https://doi.org/10.1098/rsif.2014.0349
Sahneh, F. D., Scoglio, C., & Van Mieghem, P. (2013). Generalized
epidemic mean-field model for spreading processes over multilayer complex
networks. IEEE/ACM Transactions on Networking, 21(5), 1609–1620. doi:
https://doi.org/10.1109/tnet.2013.2239658
Tanis, C. C., Leach, N. M., Geiger, S. J., Nauta, F. H., Dablander, F., Harreveld,
F. v., … Blanken, T. F. (2021). Smart Distance Lab’s art fair, experimental
data on social distancing during the COVID-19 pandemic. Scientific Data, 8,
179. doi: https://doi.org/https://doi.org/10.1038/s41597-021-00971-2
Trajanovski, S., Martín-Hernández, J., Winterbach, W., & Van Mieghem, P.
(2013). Robustness envelopes of networks. Journal of Complex Networks, 1(1),
44–62. doi: https://doi.org/10.1093/comnet/cnt004
Trofimenko, T. B., Mukhina, K. D., & Visheratin, A. A. (2016). Mobile
contacts network reconstruction using call domain records data. In 2016
third european network intelligence conference (enic) (pp. 55–60). doi:
https://doi.org/10.1109/enic.2016.016
Van De Schoot, R., Kluytmans, A., Tummers, L., Lugtig, P., Hox, J., & Muthén,
B. (2013). Facing off with Scylla and Charybdis: a comparison of scalar,
partial, and the novel possibility of approximate measurement invariance.
Frontiers in Psychology, 4, 770. doi: https://doi.org/10.3389/fpsyg.2013.00770
Van Mieghem, P. (2014). Performance analysis of complex networks and systems.
Cambridge University Press.
Van Mieghem, P., Stevanović, D., Kuipers, F., Li, C., Van De Bovenkamp,
R., Liu, D., & Wang, H. (2011). Decreasing the spectral radius of a
graph by link removals. Physical Review E, 84(1), 016101. doi:
https://doi.org/10.1103/physreve.84.016101
Van Mieghem, P., & Van de Bovenkamp, R. (2013). Non-Markovian infection
spread dramatically alters the susceptible-infected-susceptible epidemic
threshold in networks. Physical review letters, 110(10), 108701. doi:
https://doi.org/10.1103/physrevlett.110.108701
Van Mieghem, P., & van de Bovenkamp, R. (2015). Accuracy criterion
for the mean-field approximation in susceptible-infected-susceptible
epidemics on networks. Physical Review E, 91(3), 032812. doi:
https://doi.org/10.1103/physreve.91.032812
Watts, D. J., & Strogatz, S. H. (1998). Collective dynamics of ‘small-world’networks.
Nature, 393(6684), 440–442. doi: https://doi.org/10.1515/9781400841356.301
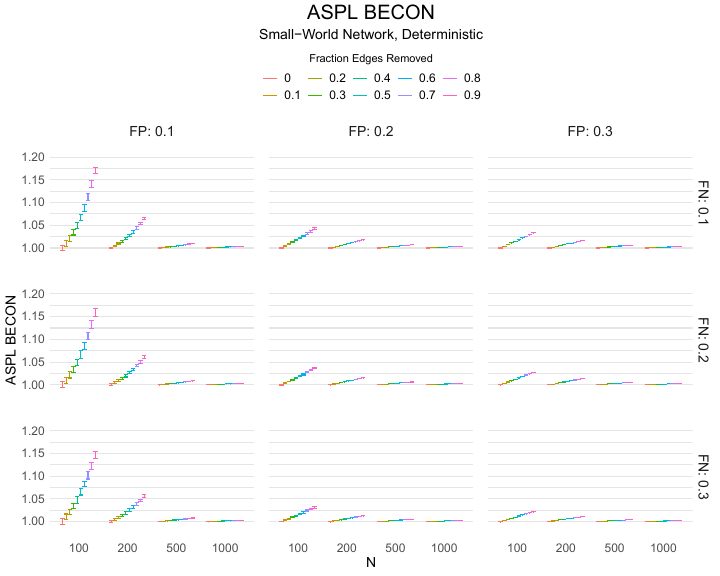
Appendix
A Simulation results
Additional tables and figures reporting the simulation results across all conditions.
Complete results are available at https://gitlab.com/science-versus-corona/becon.
A.1 Small world graph
A.2 Scale-free graph
Table 2: Simulation results across conditions for a scale free graph. The table
reports correlations (means and sd) between BECONs and intervention effect
sizes for deterministic and probabilistic interventions across simulation runs for
multiple network sizes. The results are averaged over the false negative rates.
| $n$ | FP | Deterministic | | Probabilistic
|
| | |
| |
|
| | | Density | Spectral | ASPL | | Density | Spectral | ASPL
|
| | |
| |
|
| | | $r$ | $SD$ | $r$ | $SD$ | $r$ | $SD$ | | $r$ | $SD$ | $r$ | $SD$ | $r$ | $SD$ |
| 100 | 0.1 | 1 | 0 | 1 | 0 | 1 | 0 | | 0.97 | 0.02 | 0.98 | 0.02 | 0.97 | 0.02 |
| 100 | 0.2 | 1 | 0 | 1 | 0 | 1 | 0 | | 0.92 | 0.06 | 0.93 | 0.06 | 0.92 | 0.07 |
| 100 | 0.3 | 1 | 0 | 1 | 0 | 1 | 0 | | 0.86 | 0.1 | 0.87 | 0.1 | 0.85 | 0.1 |
| 200 | 0.1 | 1 | 0 | 1 | 0 | 1 | 0 | | 0.97 | 0.03 | 0.98 | 0.02 | 0.97 | 0.03 |
| 200 | 0.2 | 1 | 0 | 1 | 0 | 1 | 0 | | 0.92 | 0.06 | 0.93 | 0.06 | 0.91 | 0.06 |
| 200 | 0.3 | 1 | 0 | 1 | 0 | 1 | 0 | | 0.85 | 0.1 | 0.86 | 0.1 | 0.84 | 0.11 |
| 500 | 0.1 | 1 | 0 | 1 | 0 | 1 | 0 | | 0.97 | 0.03 | 0.97 | 0.02 | 0.97 | 0.03 |
| 500 | 0.2 | 1 | 0 | 1 | 0 | 1 | 0 | | 0.92 | 0.06 | 0.92 | 0.05 | 0.92 | 0.06 |
| 500 | 0.3 | 1 | 0 | 1 | 0 | 1 | 0 | | 0.86 | 0.1 | 0.86 | 0.09 | 0.86 | 0.1 |
| 1000 | 0.1 | 1 | 0 | 1 | 0 | 1 | 0 | | 0.97 | 0.03 | 0.97 | 0.02 | 0.97 | 0.03 |
| 1000 | 0.2 | 1 | 0 | 1 | 0 | 1 | 0 | | 0.92 | 0.06 | 0.92 | 0.05 | 0.92 | 0.06 |
| 1000 | 0.3 | 1 | 0 | 1 | 0 | 1 | 0 | | 0.86 | 0.1 | 0.86 | 0.1 | 0.86 | 0.1 |
| |
A.3 Erdős–Rényi random graph
Table 3: Simulation results across conditions for a Erdős–Rényi graph. The
table reports correlations (means and sd) between BECONs and intervention
effect sizes for deterministic and probabilistic interventions across simulation
runs for multiple network sizes. The results are averaged over the false negative
rates.
| $n$ | FP | Deterministic | | Probabilistic
|
| | |
| |
|
| | | Density | Spectral | ASPL | | Density | Spectral | ASPL
|
| | |
| |
|
| | | $r$ | $SD$ | $r$ | $SD$ | $r$ | $SD$ | | $r$ | $SD$ | $r$ | $SD$ | $r$ | $SD$ |
| 100 | 0.1 | 1 | 0 | 1 | 0 | 1 | 0 | | 0.97 | 0.02 | 0.97 | 0.02 | 0.97 | 0.02 |
| 100 | 0.2 | 1 | 0 | 1 | 0 | 1 | 0 | | 0.92 | 0.06 | 0.92 | 0.06 | 0.92 | 0.06 |
| 100 | 0.3 | 1 | 0 | 1 | 0 | 1 | 0 | | 0.85 | 0.11 | 0.85 | 0.11 | 0.84 | 0.11 |
| 200 | 0.1 | 1 | 0 | 1 | 0 | 1 | 0 | | 0.97 | 0.02 | 0.97 | 0.03 | 0.97 | 0.02 |
| 200 | 0.2 | 1 | 0 | 1 | 0 | 1 | 0 | | 0.92 | 0.05 | 0.92 | 0.05 | 0.92 | 0.06 |
| 200 | 0.3 | 1 | 0 | 1 | 0 | 1 | 0 | | 0.85 | 0.09 | 0.85 | 0.1 | 0.85 | 0.09 |
| 500 | 0.1 | 1 | 0 | 1 | 0 | 1 | 0 | | 0.97 | 0.03 | 0.97 | 0.03 | 0.97 | 0.03 |
| 500 | 0.2 | 1 | 0 | 1 | 0 | 1 | 0 | | 0.92 | 0.06 | 0.92 | 0.06 | 0.92 | 0.06 |
| 500 | 0.3 | 1 | 0 | 1 | 0 | 1 | 0 | | 0.85 | 0.1 | 0.85 | 0.1 | 0.85 | 0.1 |
| 1000 | 0.1 | 1 | 0 | 1 | 0 | 1 | 0 | | 0.97 | 0.03 | 0.97 | 0.03 | 0.96 | 0.03 |
| 1000 | 0.2 | 1 | 0 | 1 | 0 | 1 | 0 | | 0.91 | 0.06 | 0.91 | 0.06 | 0.91 | 0.06 |
| 1000 | 0.3 | 1 | 0 | 1 | 0 | 1 | 0 | | 0.85 | 0.11 | 0.85 | 0.11 | 0.85 | 0.11 |
| |