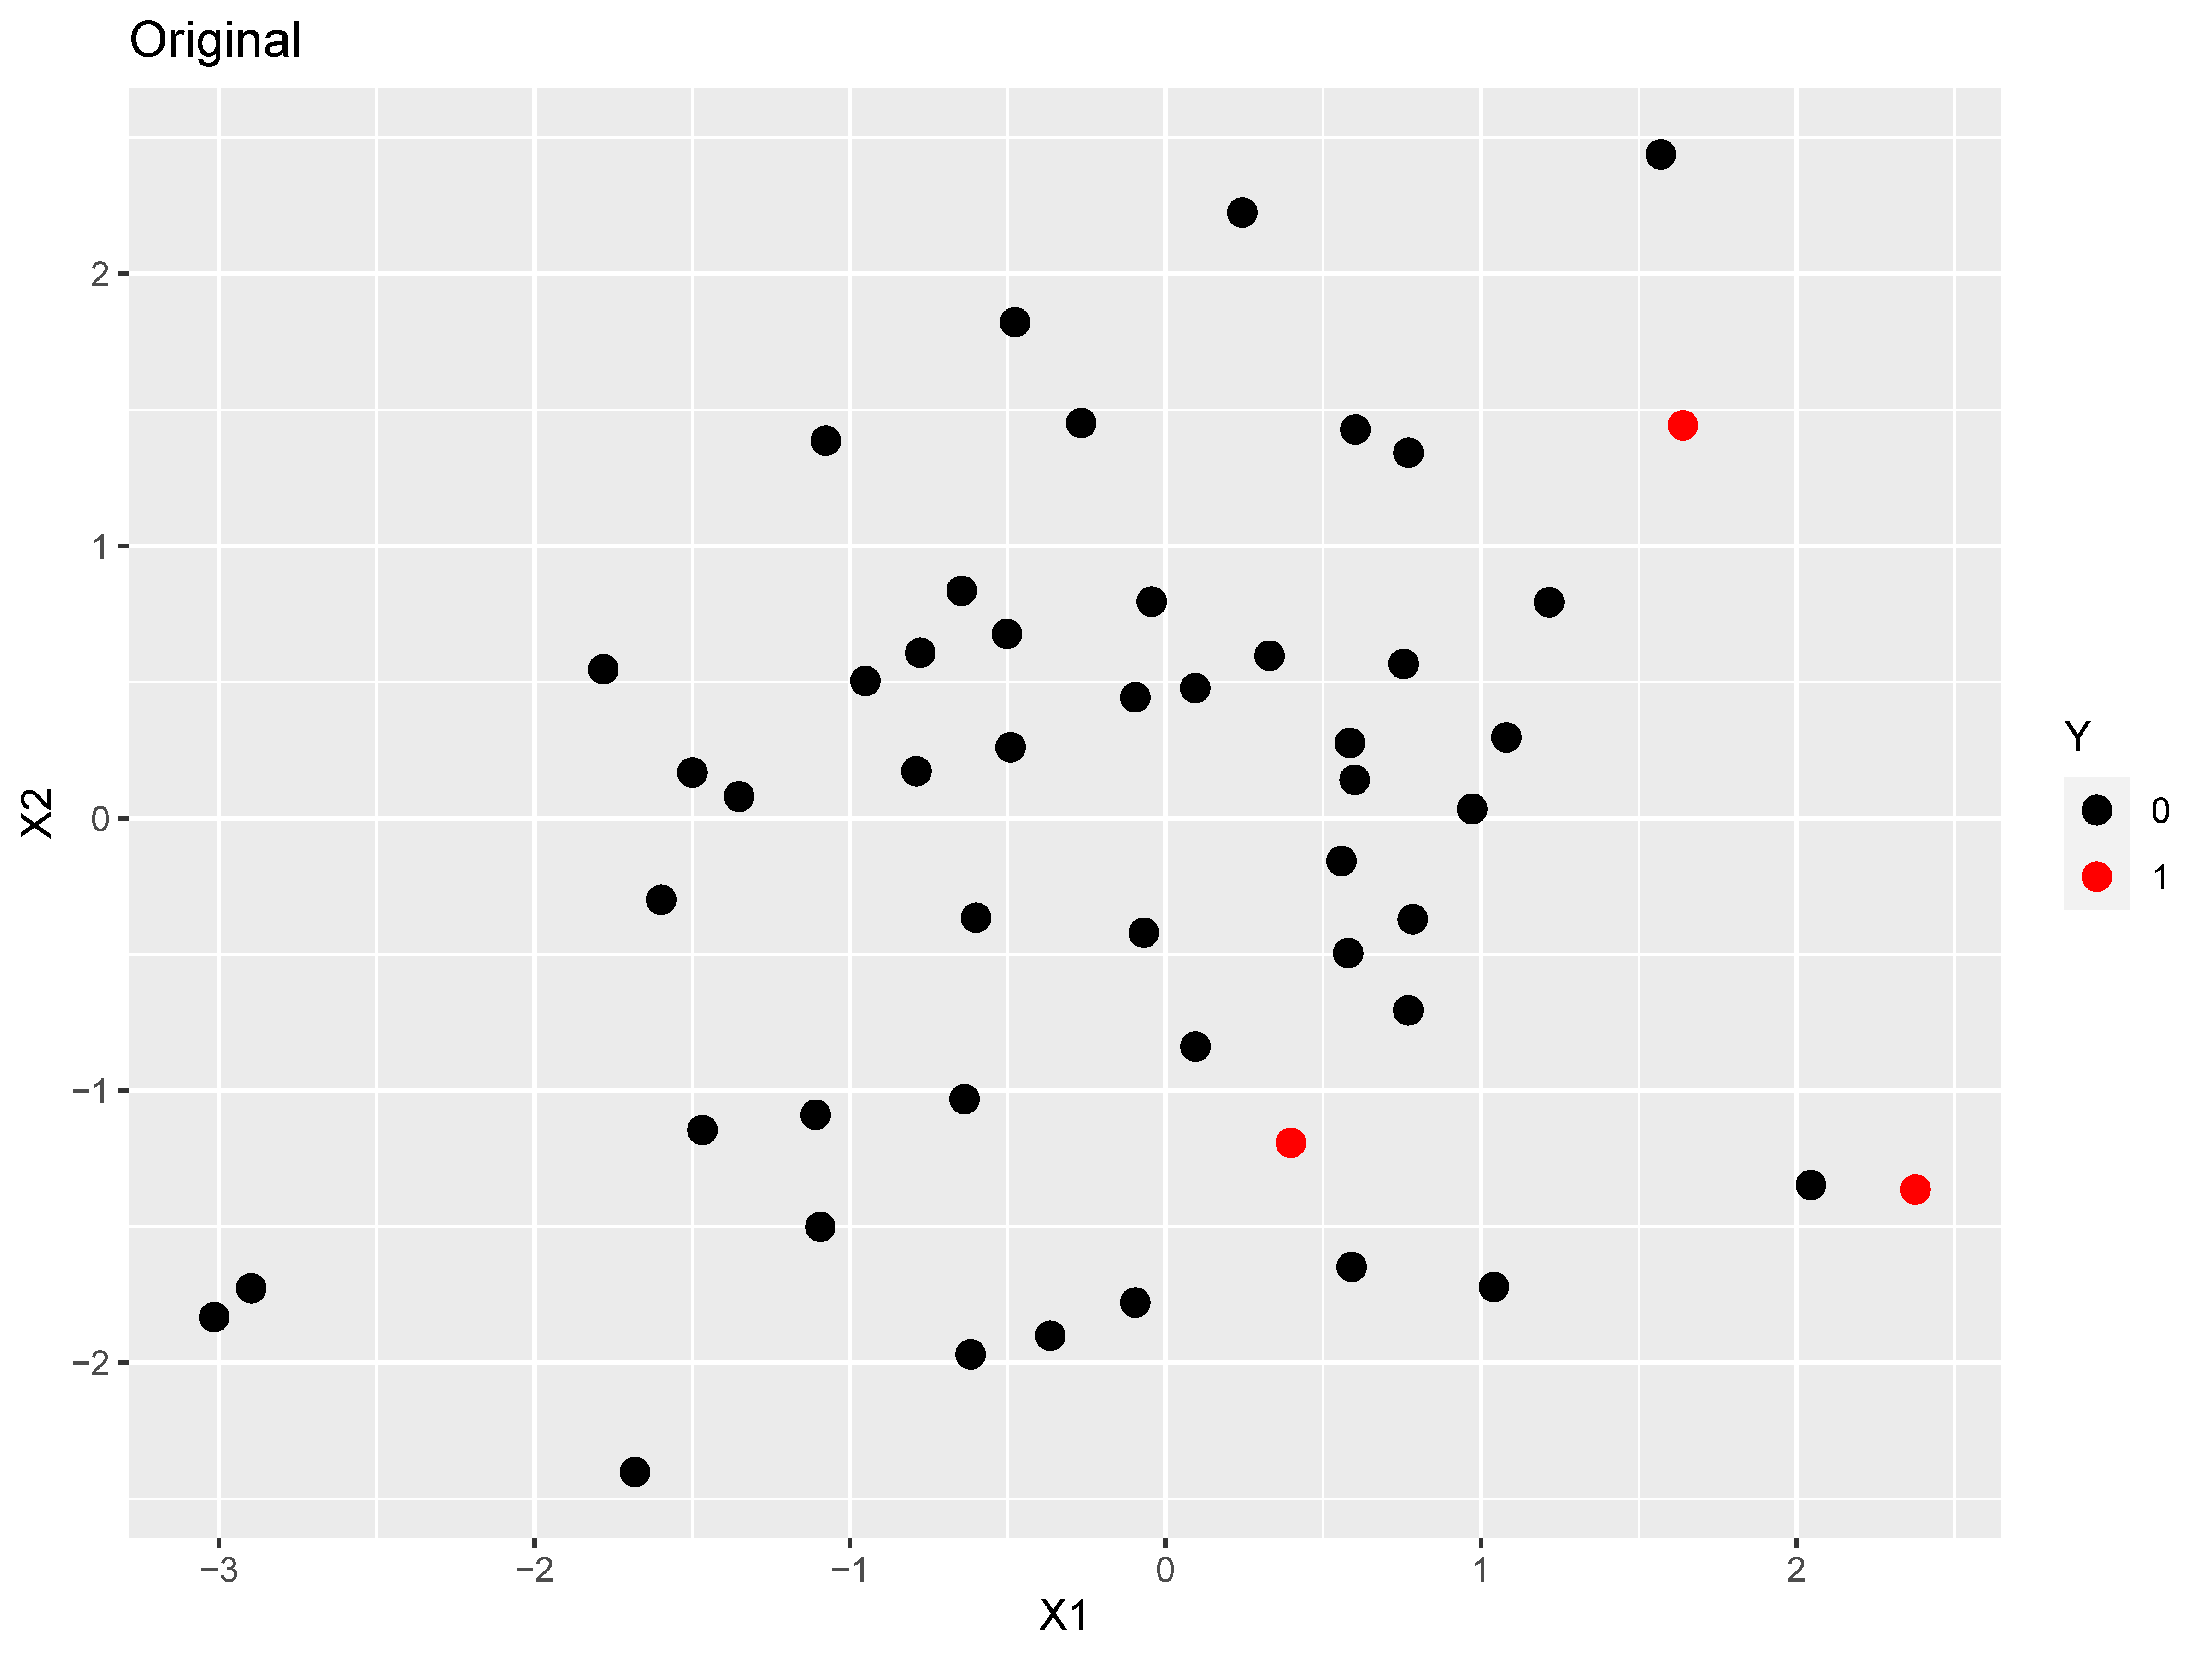
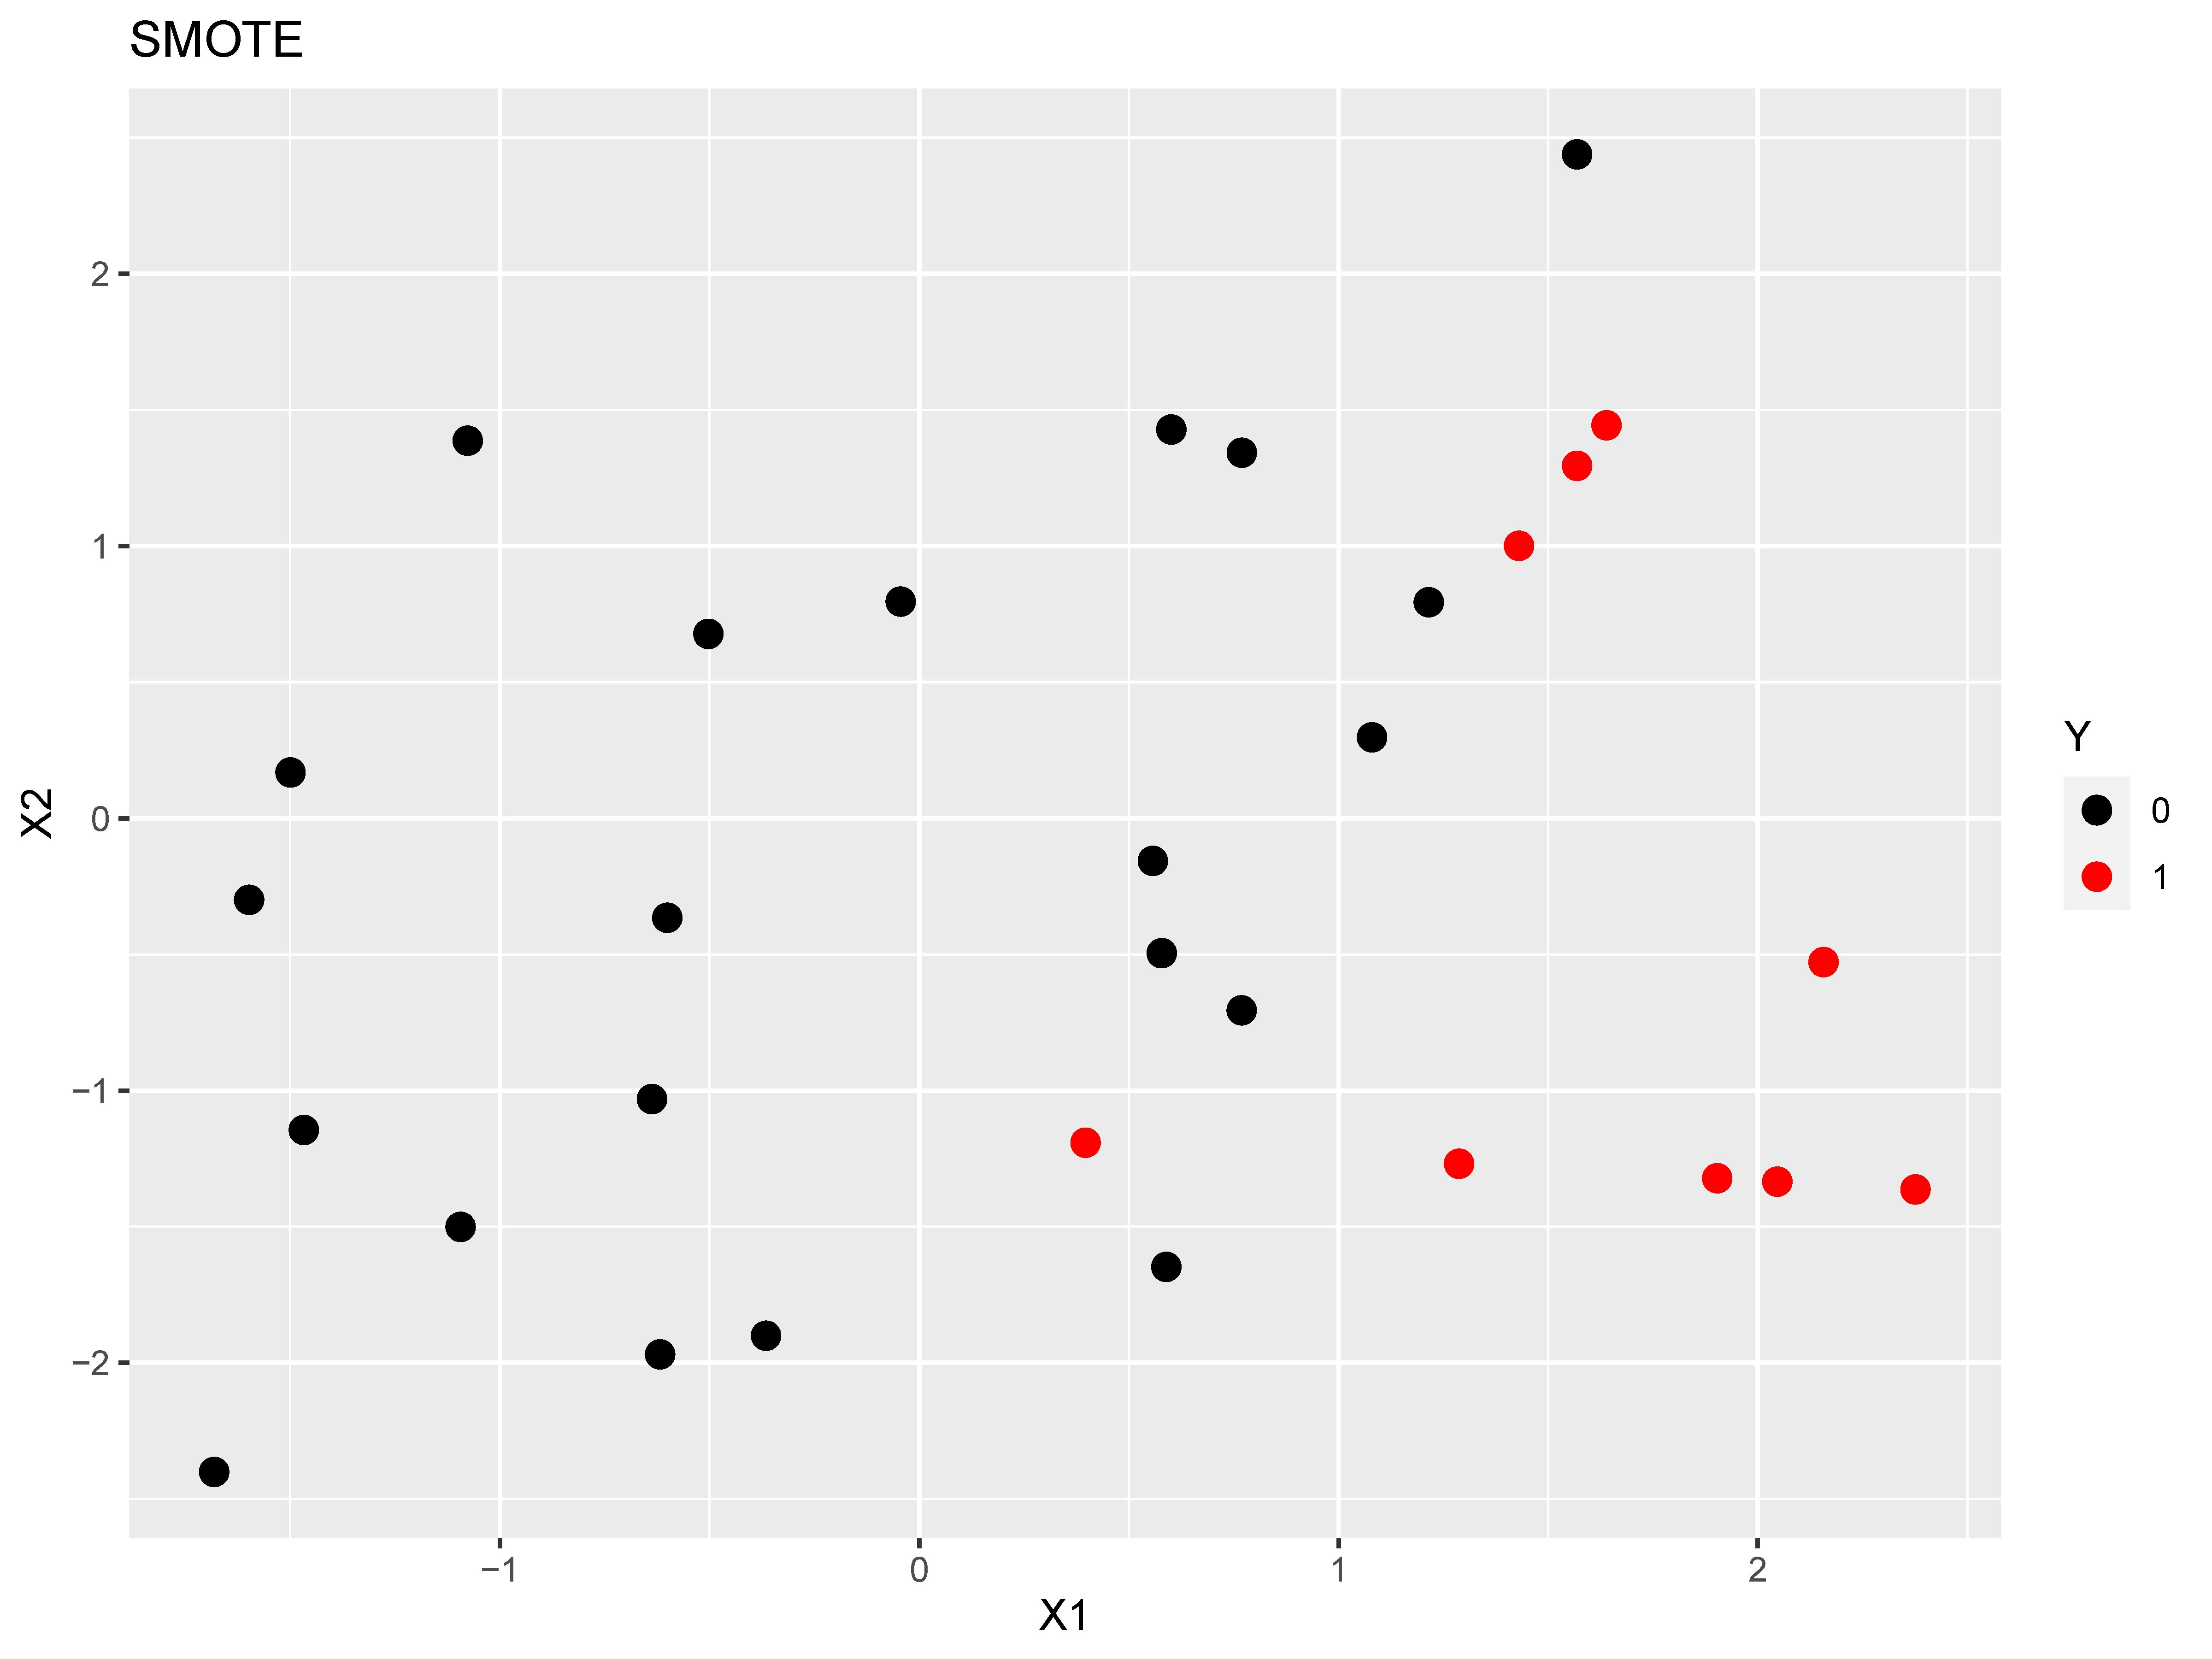
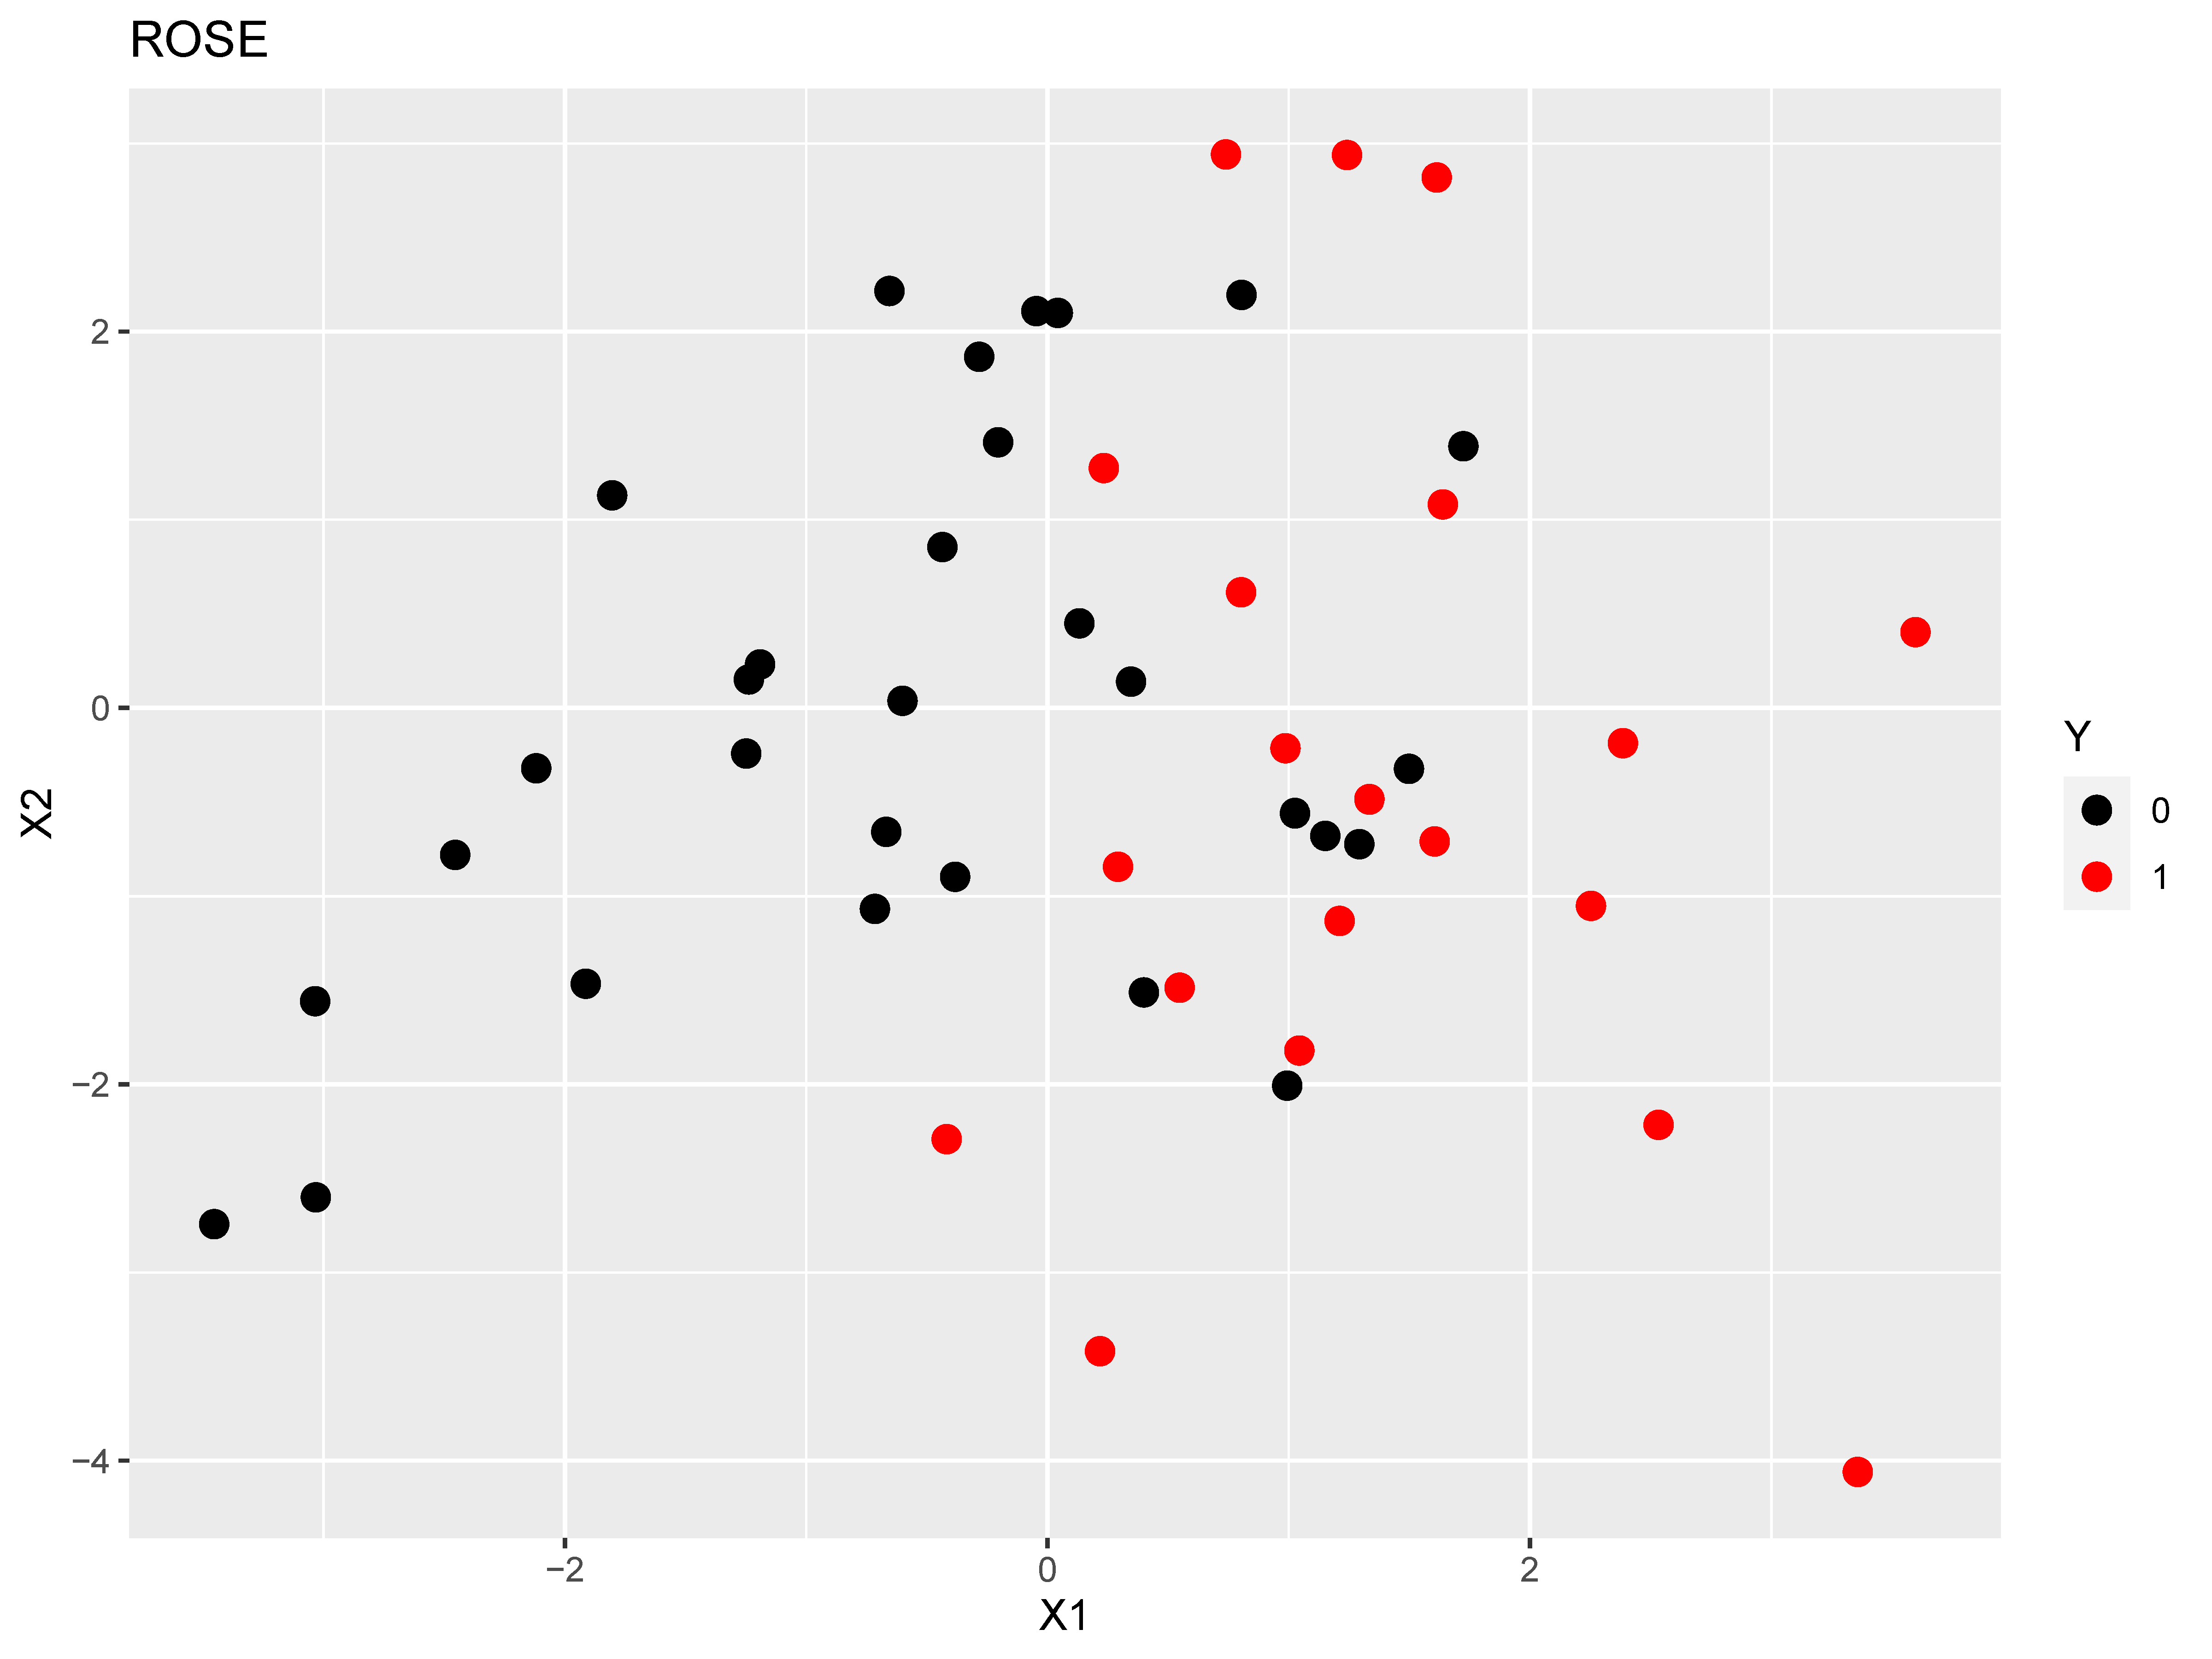
Figure 1: The top plot is the original dataset, the middle figure is after applying
SMOTE, while the bottom figure is after applying ROSE.
Keywords: Imbalanced data · Sampling strategies · Machine learning
In psychological research, class imbalance in binary outcome variables (also referred to as skew or rare events), most often occurs due to the underlying population of interest having small proportions of individuals with positive cases (minority), such as in the case of study designs that are assessing the prevalence of suicidal attempts in the general population. While class imbalance can be dealt with through changes in study design, such as sampling among individuals with a history of mental illness to increase the probability of observations having a history of suicide attempts, this can fundamentally alter the alignment between the population of interest and the sample of which the data is collected from.
In the presence of class imbalance, failure to utilize appropriate strategies has a number of consequences. For instance, even when explanation is the primary aim, using logistic regression with skewed outcomes can result in underestimated probabilities for the positive class (King & Zeng, 2001). Additionally, one of the general strategies is to perform data augmentation through random sampling from just the positive cases, or from both the positive and negative cases. Kovács (2019) found that in general, any form of sampling improves upon the performance modeling the original dataset.
However, even in areas of psychological research where imbalanced outcomes are extremely common, such as suicide, the use of sampling strategies is still extremely rare (e.g., a recent tutorial on evaluating classification in suicide research does not mention sampling strategies; Mitchell, Cero, Littlefield, & Brown, 2021). While part of this lack of translation across disciplines may be due to relatively siloed research, it also may partially be attributed to a lack of generalizability in the findings. While a large number of studies have evaluated the relative performance of methods designed to overcome class imbalance, the vast majority of research focuses on evaluation in benchmark datasets with characteristics unique to that field of study (primarily computer science), which limits the generalizability of these findings to areas with different types of data including psychology. This is similar to the hype and promise of machine learning being somewhat diluted by limitations to the data commonly found in psychological research (see Jacobucci & Grimm, 2020).
Thus, the goal of this study is to answer the question: Do minority case sampling approaches improve prediction with imbalanced outcomes in datasets with psychological variables? To accomplish this, we evaluated a number of sampling strategies commonly used for imbalanced outcomes in simulated data that is more in line with characteristics commonly found in psychological research. We followed this by applying those strategies to the prediction of suicidal ideation in a large public dataset. Additionally, we specifically focus on strategies for overcoming class imbalance that are already implemented in easy-to-use software. Our focus is on strategies that operate at the data level, as opposed to the model estimation phase. While we test two different algorithms, logistic regression and random forests, we put our focus on methods that do not involve the use of misclassification costs for a number of reasons. The first is that sampling methods are easy to implement in easy-to-use software that pairs with many ML algorithms, meaning researchers won’t face limitations with which algorithms can be compared. Further, sampling based methods have been studied more (e.g., García, Sánchez, Marqués, Florencia, & Rivera, 2020) thus often show up more in recommendations. And finally, assigning costs does not overcome potential issues of few to no positive cases being represented when the sample size is small and k-fold cross-validation (CV) is used.
While a number of strategies have been proposed for supervised learning with imbalance data, possibly the two simplest are random over-sampling (OVER) and random under-sampling (UNDER). While OVER random samples from the minority case to produce an equal distribution of positive and negative cases, UNDER randomly removes majority cases to produce an equal distribution. As an example, of an original dataset with 10 positive cases and 100 negative cases, OVER would produce a new dataset with 100 positive and negative cases each, while UNDER would create a dataset with 10 positive and negative cases each. Both methods have well understood drawbacks: while UNDER discards potentially useful data, OVER increases the probability of overfitting (McCarthy, Zabar, & Weiss, 2005).
SMOTE (Chawla, Bowyer, Hall, & Kegelmeyer, 2002) is an oversampling technique that creates artificial minority class cases by using the k-nearest neighbors for a given minority case instead of oversampling randomly as in OVER. More specifically, for a specific minority case i, instead of just creating duplicates of that case, the SMOTE algorithm finds k similar minority cases to case i, and generates synthetic cases that take on a value for the predictor variables that represent a blend of the k-nearest neighbors. Thus, the newly created synthetic minority cases contain similar, not identical, predictor values to the k-nearest neighbors. Finally, the number of synthetic cases created for each minority case is a tuning parameter typically referred to as $N_{percent}$.
While SMOTE only generates synthetic samples from the positive cases, ROSE (Menardi & Torelli, 2012) uses the smoothed bootstrap to generate both negative and positive samples to create a new dataset that is more balanced. In the ROSE procedure, an observation is first drawn with a 50% chance of belonging to each class. Given this observation, a new sample is then generated in its neighborhood (according to the predictor values), with the neighborhood chosen according to a kernel density estimate (for further detail, see Menardi & Torelli, 2012). The user of ROSE is given discretion as to how much under-sample the negative cases, and to what degree over-sample the positive cases.
To demonstrate how SMOTE and ROSE randomly over sample minority cases, we simulated 50 cases according to a linear logistic model with two predictors (regression coefficients of 0.2 and 0.4) and an intercept of -3, which resulted in 47 negative cases and 3 positive cases. This was followed by applying each method with the DMwR package (Torgo, 2010) and ROSE package (Lunardon, Menardi, & Torelli, 2014). The resulting datasets are displayed in Figure 1.
We can see in Figure 1 that both methods oversample the positive cases, generating new data points based on the original positive cases. Additionally, the two methods handle the negative cases in different ways: SMOTE uses a hyperparameter (we selected 500%) to select the percentage of negative cases that are selected relative to the number of positive cases generated; ROSE requires setting a hyperparameter to determine the percentage of positive cases that end up in the new dataset (defaults to 0.5), with the negative cases making up the remainder to have the sample size equal to the original sample.
SMOTE has been widely applied across an assortment of research domains. Evaluating its performance in applied data is complicated by a number of factors, but one primary concern is on the differences in which classification performance metrics are reported. For instance, Nnamoko and Korkontzelos (2020) used data with diabetes diagnosis as the outcome, but mainly focused on improvements due to SMOTE in accuracy. However, the calculation of accuracy is based on the class distribution, which is discrepant across the various ways that Nnamoko and Korkontzelos evaluated the use of SMOTE. Most studies have primarily focused on evaluating the area under the receiver operator characteristic (ROC) curve (AUC; Hanley & McNeil, 1982), or the area under the precision-recall curve (AUPRC; He & Garcia, 2009). There exist multiple additional methods that incorporate similar types of information (e.g., see Saito & Rehmsmeier, 2015), however, these two have received the most coverage. Whereas the AUC encompasses the contrast between sensitivity and specificity, thus information regarding both classes, the AUPRC contrasts recall with precision, thus only encodes information regarding positive cases. While the AUC is more commonly used in practice, there are concerns regarding the AUC being misleading in the presence of imbalance (Lobo, Jiménez-Valverde, & Real, 2008), with findings that the AUPRC is more informative when classes are imbalanced (Saito & Rehmsmeier, 2015). Therefore, we will focus on both the AUC and AUPRC, but give preference to the AUPRC.
An additional complication in evaluating methods for handling imbalance is the research domain of concern. Many studies that evaluate methods for handling imbalance use benchmark datasets from that research area. For instance, a recent study by Shin et al. (2021) examined the bloom of cyanobacteria in rivers in South Korea. With this data, the researchers found differences in performance among various classifiers (e.g., ensembles outperformed single models), but only marginal performance gains in the application of SMOTE. Notably, they did not evaluate the AUPRC. In a different area of application, Zhu, Baesens, and vanden Broucke (2017) examined class imbalance strategies in the area of customer churn prediction, evaluating performance in terms of the AUC, and comparing ensemble methods paired with various sampling strategies and cost-sensitive learning. Again, ensemble methods outperformed simpler algorithms, however, there did not seem to be a benefit to more complex sampling strategies above and beyond over or under-sampling. Finally, Demir and Şahin (2022) examined the impact of classification algorithms and oversampling methods for soil liquefaction evaluation, finding that SMOTE outperformed both OVER and ROSE.
Among relatively simple strategies for handling class imbalance, over-sampling is typically preferred over under-sampling (e.g., Batista, Prati, & Monard, 2004; Buda, Maki, & Mazurowski, 2018). In simulated and benchmark datasets, García et al. (2020) compared under-sampling, over-sampling, and a hybrid of both to just the use of the original dataset, confirming prior research that over-sampling outperforms under-sampling.
A further complication in this is that originally proposed over-sampling methods can be subject to different interpretation, resulting in varying implementations. To address this, Bajer, Zonc, Dudjak, and Martinovic (2019) tested four possible variants on the original SMOTE implementation, along with more recently proposed generalizations of SMOTE. On a number of benchmark datasets, they found that all of the variants outperformed random over-sampling and no sampling, with the highest performance attributed to the recently proposed Weighted-SMOTE (Prusty, Jayanthi, & Velusamy, 2017).
A recent study attempting to provide benchmark performance metrics for a host of recently proposed advancements on a large number of benchmark datasets, evaluated with multiple ML algorithms with repeated k-fold cross-validation (Kovács, 2019). They found that the biggest improvements were attributed to the use of any reliable over-sampling method over no sampling, with much smaller improvements due to the use of the best performing methods over standard SMOTE oversampling. However, importantly for our purposes, this study did not test random over-sampling, and like most other studies, used a large number of benchmark datasets.
One key piece in applying over-sampling is to ensure that augmented datasets are not created prior to splitting the dataset up into training and tests sets, as this can lead to overly-optimistic performance due to data leakage (e.g., Vandewiele et al., 2021). This can be attributed to copies, either exact or very similar, of original cases being included in both the training and tests sets. In R package caret (Kuhn, 2008), the resampling is conducted inside of cross-validation or bootstrap sampling. As an example, in 5-fold CV, each partition that is created with 4/5ths of the sample is then subject to over-sampling, the model is trained, then tested on the 1/5th sample that was not subject to sampling. However, of note, if one has a true test set that is only used for assessing the final model’s performance, sampling should not be conducted in this sample, as it is used only to test a previously trained model.
Finally, much less research has focused on the interaction between the use of sampling and the actual sample size of the dataset. Studying this interaction is further complicated by the form of resampling used to evaluate prediction performance, as the most commonly used form, k-fold CV, has been shown to produce highly biased results in small samples (Vabalas, Gowen, Poliakoff, & Casson, 2019). However, the presence of a binary outcome further complicates defining what sample size is given that assessing the number of positive cases is more informative than the overall number of cases (cf. Peduzzi, Concato, Kemper, Holford, & Feinstein, 1996).
We specifically chose this study design as we believe that it mimics the structure found in the majority of clinical data that primarily includes self-report data. While we assess the influence of nonlinear relationships, we primarily simulate the data according to a linear model, as this is most in line with the results that utilize machine learning algorithms in clinical self-report data: if machine learning outperforms linear models, the improvement in performance is most often negligible (Christodoulou et al., 2019; Jacobucci, Littlefield, Millner, Kleiman, & Steinley, 2021). For the simulation setup, we started by simulating standard normally distributed data with a sample size of 50,000. The cases not selected to train and test the methods were kept in order to produce performance metrics that serve as ground truth.
In predictive tasks with class outcomes, there are often two layers of assessment. The first step in prediction-oriented tasks is often assessing the correspondence between the predicted probabilities and actual class labels, while further performance assessment can be taken in translating the predicted probabilities to predicted class labels to classify individuals. Given that much of psychological research is only focused with the first step, our aim is only assessing prediction performance. We interpret performance with respect to the AUC and AUPRC. While the AUPRC is more informative at higher degrees of imbalance, the AUC is much less likely to evidence floor effects, thus improving our ability to characterize its distribution. When making specific comparisons in performance across methods, we used an ANOVA with Tukey’s HSD posthoc tests.
With this setup, we varied a number of conditions across 200 repeats: To train and test the methods we tested sample sizes of 300, 1000, and 10,000. With these sample sizes, we simulated data following a logit link, while varying the intercept ($b_0$) to control the level of class imbalance. We specifically tested values of -4 ($\approx 0.02$ positive), -3 ($\approx 0.05$ positive), -2 ($\approx 0.12$ positive), -1 ($\approx 0.27$ positive), and 0 ($\approx $ balanced case). We tested the inclusion of 30 and 70 predictors, with 10% of the predictors having standardized coefficients of 0.2, 10% having 0.1, 10% having 0.05, and the rest 70% having coefficients of 0. Additionally, we added two standard normal predictors with unit weighted cosine and sine relationships with Y, and a $tanh$ interaction between these variables with coefficients of 0.1. Although the exact functional form of these nonlinear relationships is unlikely to occur in psychological data, our focus is less on identifying the true relationships and more on determining whether nonlinearity interacted with imbalance to bias our model performance or algorithm selection. Following the logistic model, we also tested residual variances of 0.82 and 0.3. Once this normally distributed version of Y was created, it was transformed into a probability according to a logit link to a probability, followed by using a binomial distribution to generate values of 0 and 1. Finally, we included Bayesian logistic regression (Bayesian as this resulted in fewer convergence issues when the class imbalance was large and sample size small) and random forests (Breiman, 2001). Our goal in this comparison was to test the potential of underfitting and overfitting, particularly given prior findings regarding overfitting with ROS. Our specific point of comparison is in assessing the performance of random forests with sampling to determine whether inflated AUC or AUPRC values are found.
Outside of the simulated intercept values, our main point of evaluation concerned the resampling and sampling methods. For resampling, we tested the validation set approach or 10-fold CV. The validation set approach applied the sampling method on a training set that contained 70% of N, followed by testing on a holdout set containing 30% of N that was not used to train the model. The 10-fold CV approach used the sampling approach on each training set for each 10 iterations. Note that for both approaches the sampling method was used after splitting the sample and was not applied to the holdout set. Finally, our goal in assessing sampling methods was to test methods that are easy to apply in commonly used software. Given this, we focused on the methods available in the caret package (Kuhn, 2008) in R. This included no sampling, UNDER, OVER, SMOTE, and ROSE. SMOTE is implemented in the DMwR package (Torgo, 2010), while ROSE is implemented in the ROSE package (Lunardon et al., 2014). We used the software defaults for both SMOTE and ROSE.
Of the 200 replications across conditions, errors occurred in estimating models in a subset of conditions, namely due to the condition with a sample size of 300 and intercept of -4 (11% errors). All other conditions had less than 2% errors. Given the breadth of results, we chose only to present a select subset of findings that highlight key points.
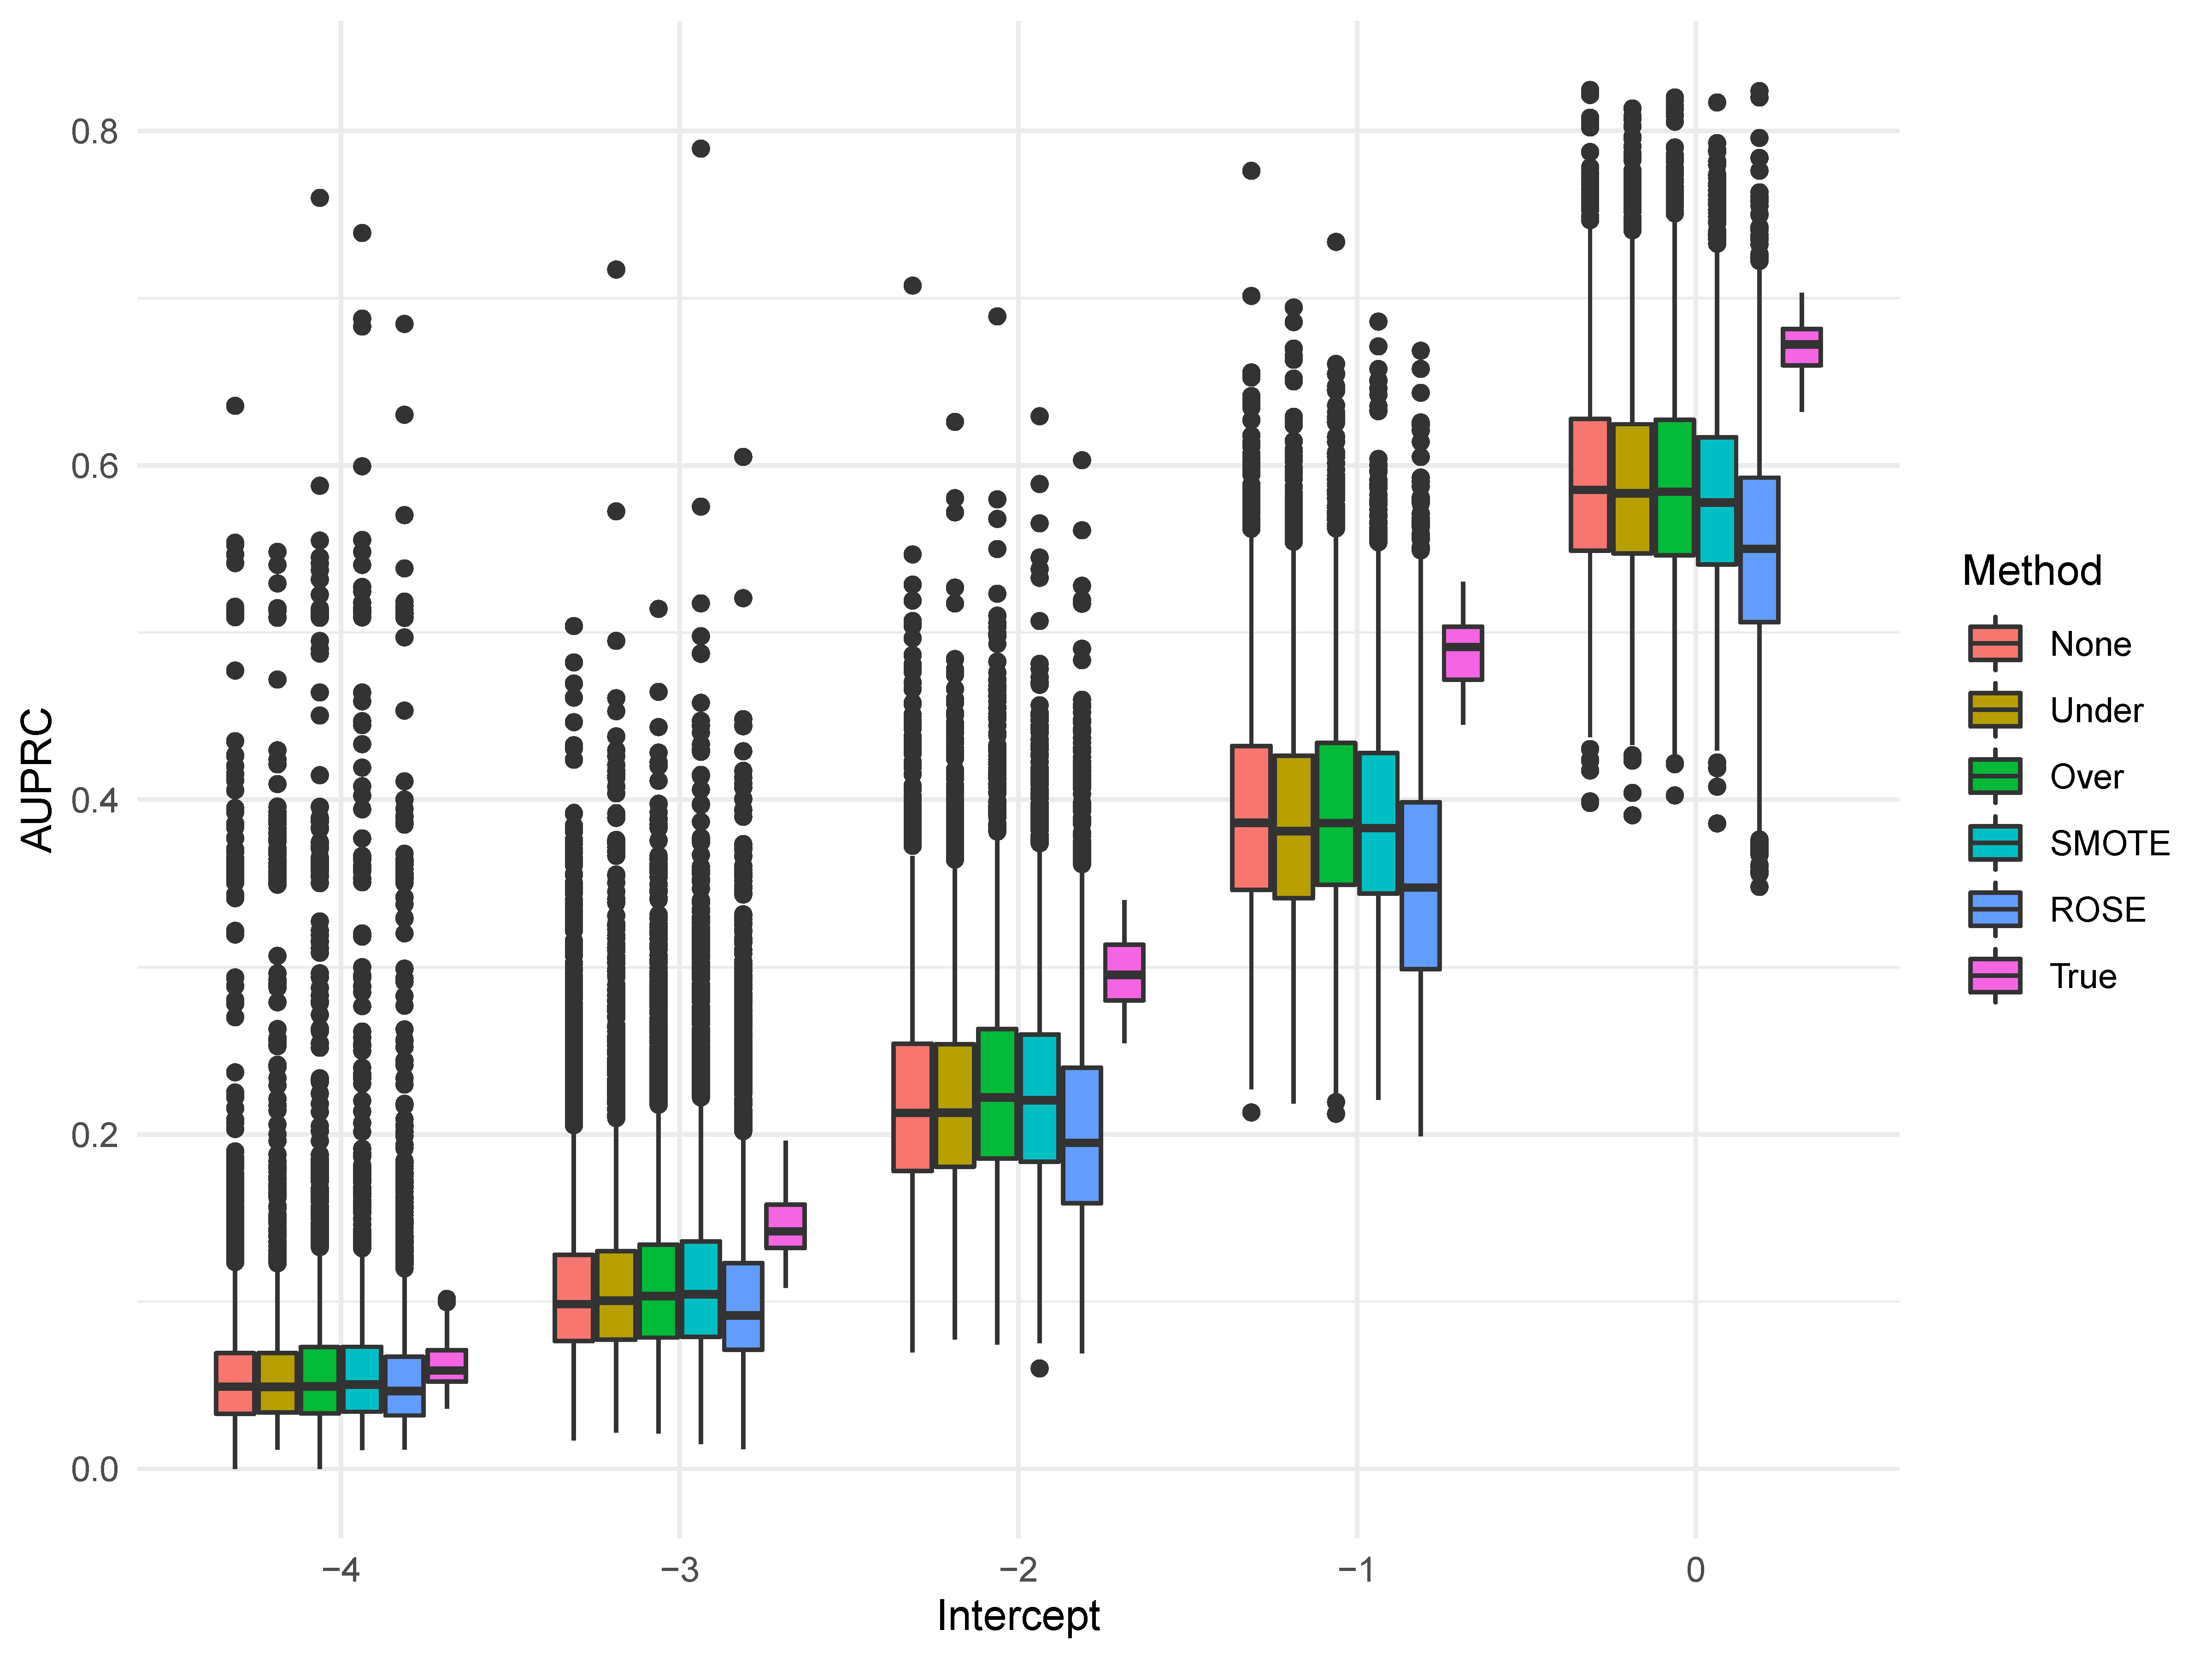
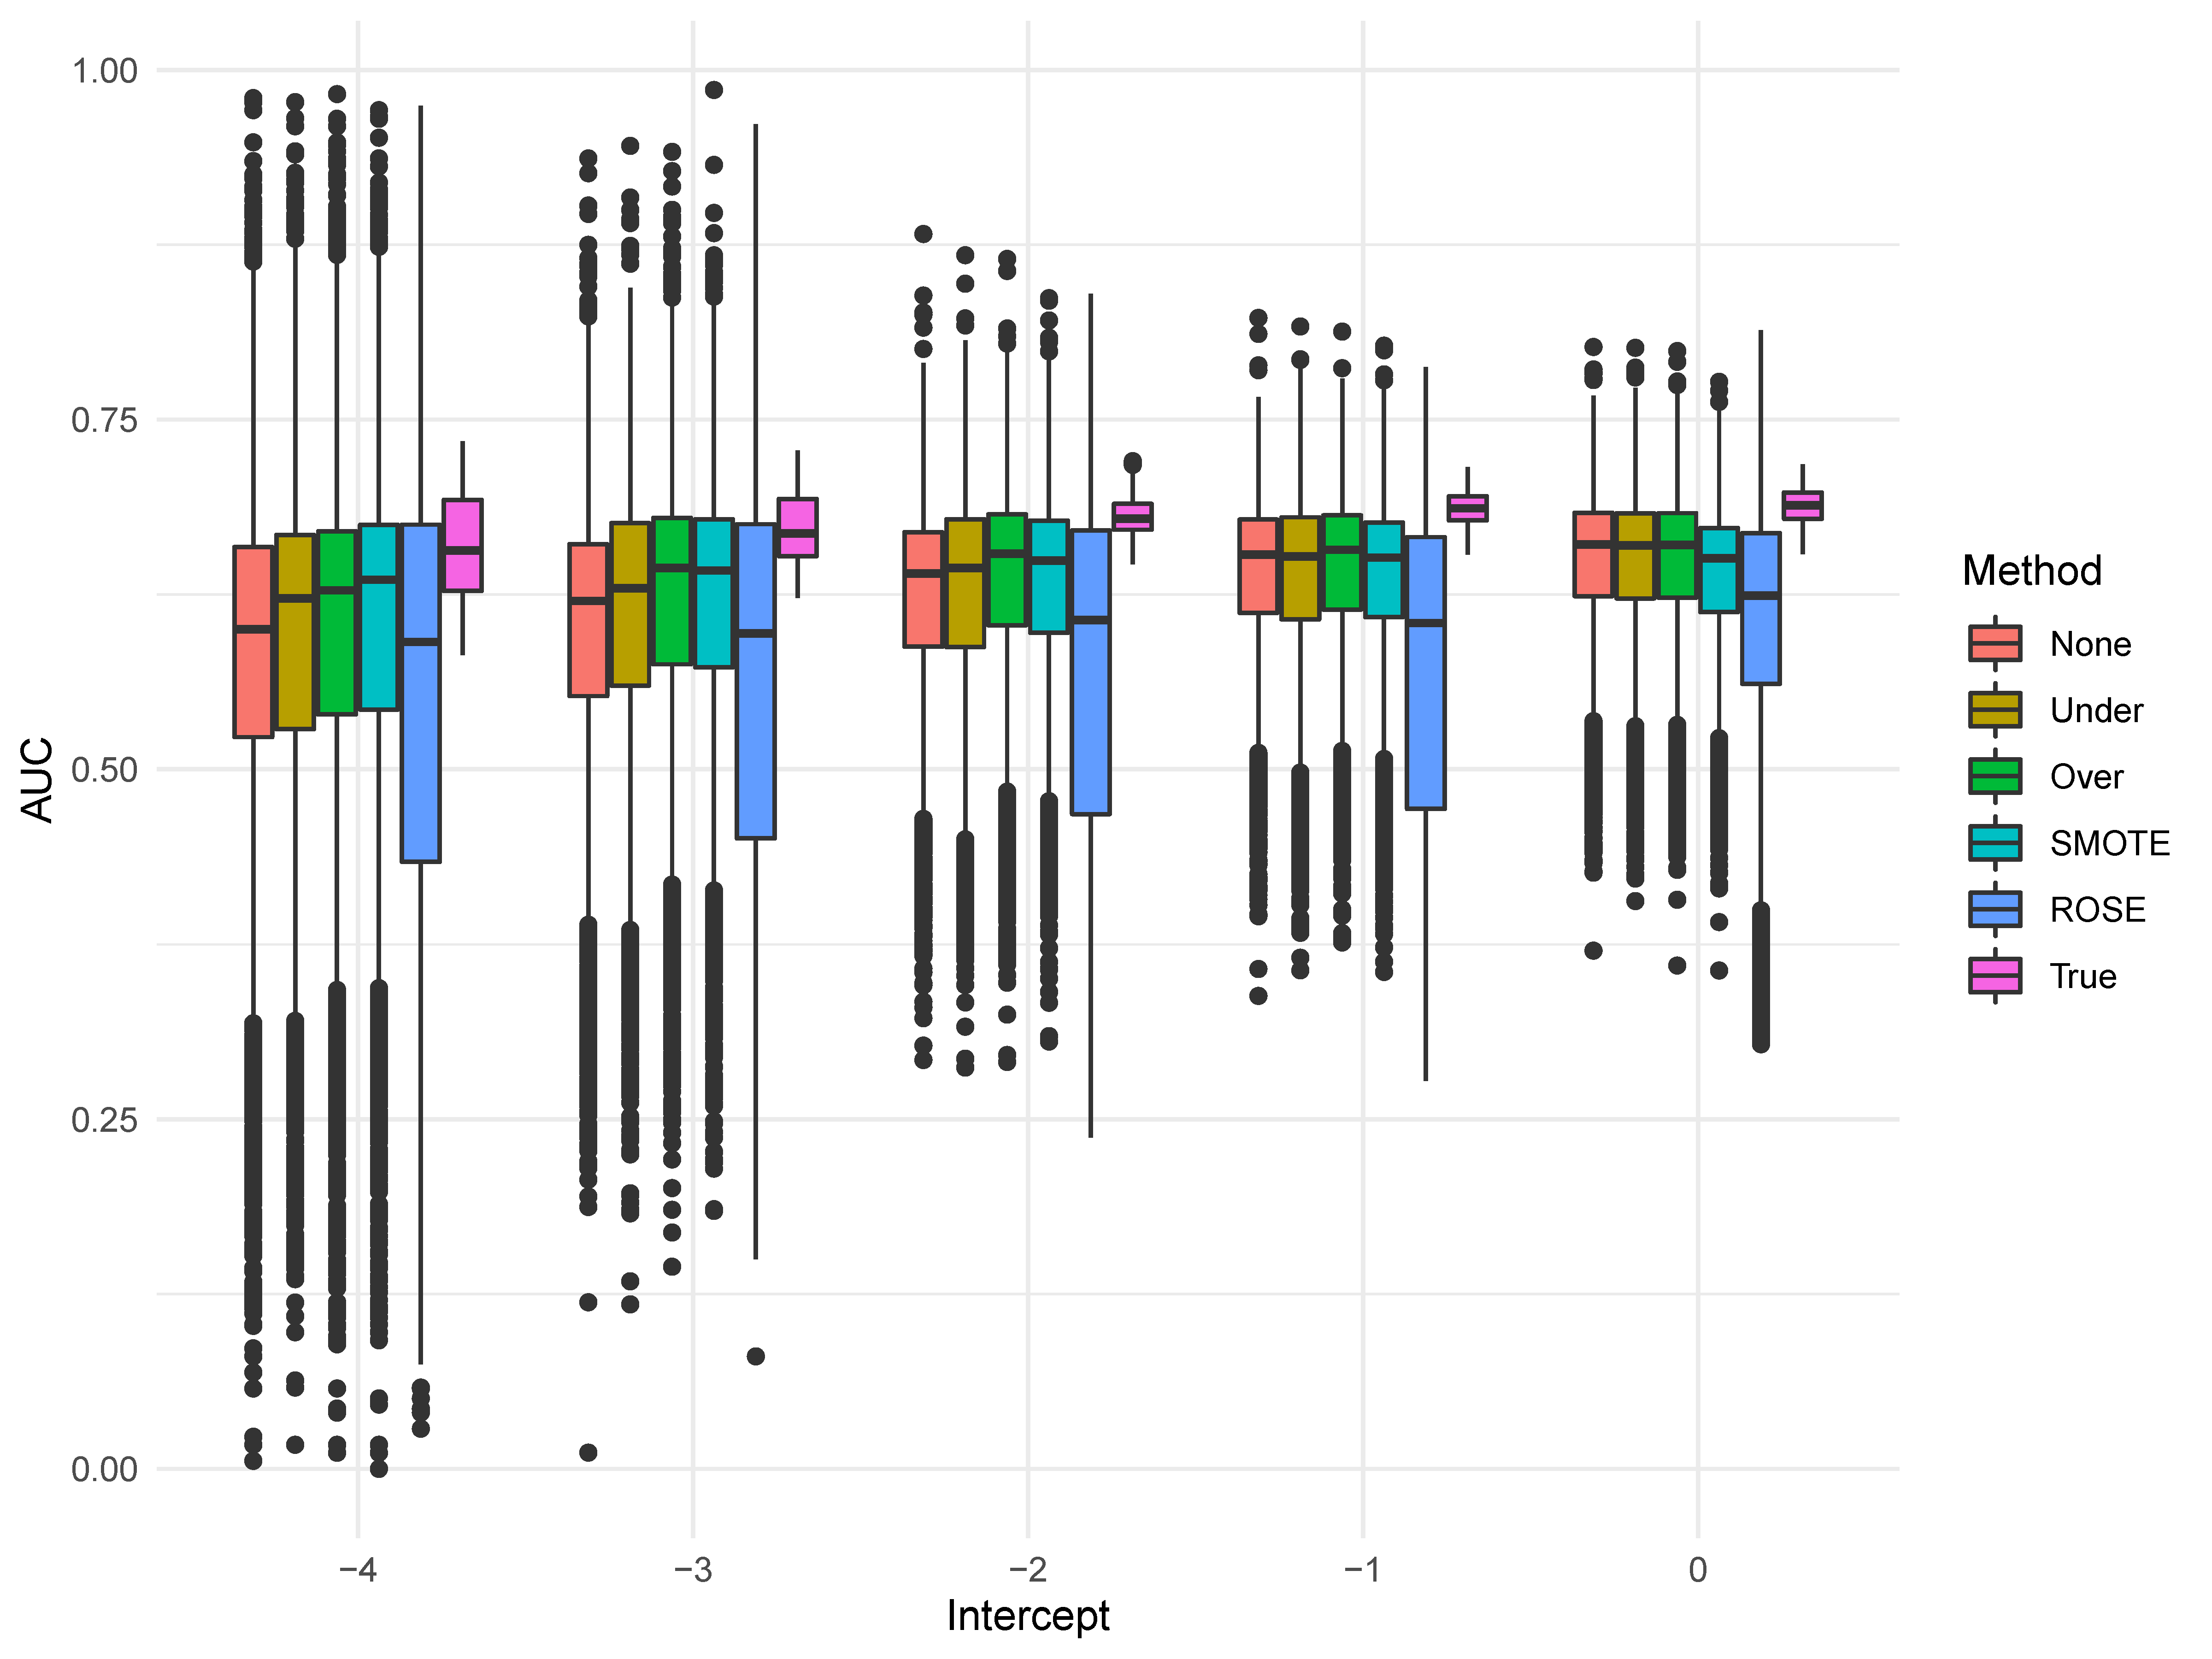
Possibly the largest influence of class imbalance is on the degree of variability to the AUC and AUPRC. This can be clearly seen in Figure 2. With an intercept of -4, all of the sampling methods evidence a number of outliers that are strongly positively biased. However, this represented a quite small number of results, as the 95th percentile at an intercept of -4 was 0.13 for OVER and SMOTE.
Additionally, we can see the median AUC and AUPRC values for the sampling methods get closer to the True performance as the imbalance becomes less. This is further influence by sample size and can be attributed to a lack of information when there are fewer positive cases, leading to further degrees of underfitting by default. As an example, when the intercept is -4, there is a difference in AUC means of 0.06 between OVER and the True performance (0.596 vs. 0.660), while for an intercept of 0 it is 0.04 (0.648 vs. 0.688).
Lastly, while the AUC is commonly labeled as biased in the presence of imbalanced data, it demonstrated similar performance across values of $b_0$ as the AUPRC. Performance improves as the class distribution becomes more equal; this is most likely attributable to the increasing numbers of positive cases. In fact, when the intercept was -4, the AUC was on average 0.09 points higher when the sample size was 10,000 as opposed to 300, while the discrepancy fell to 0.06 when the intercept was 0.
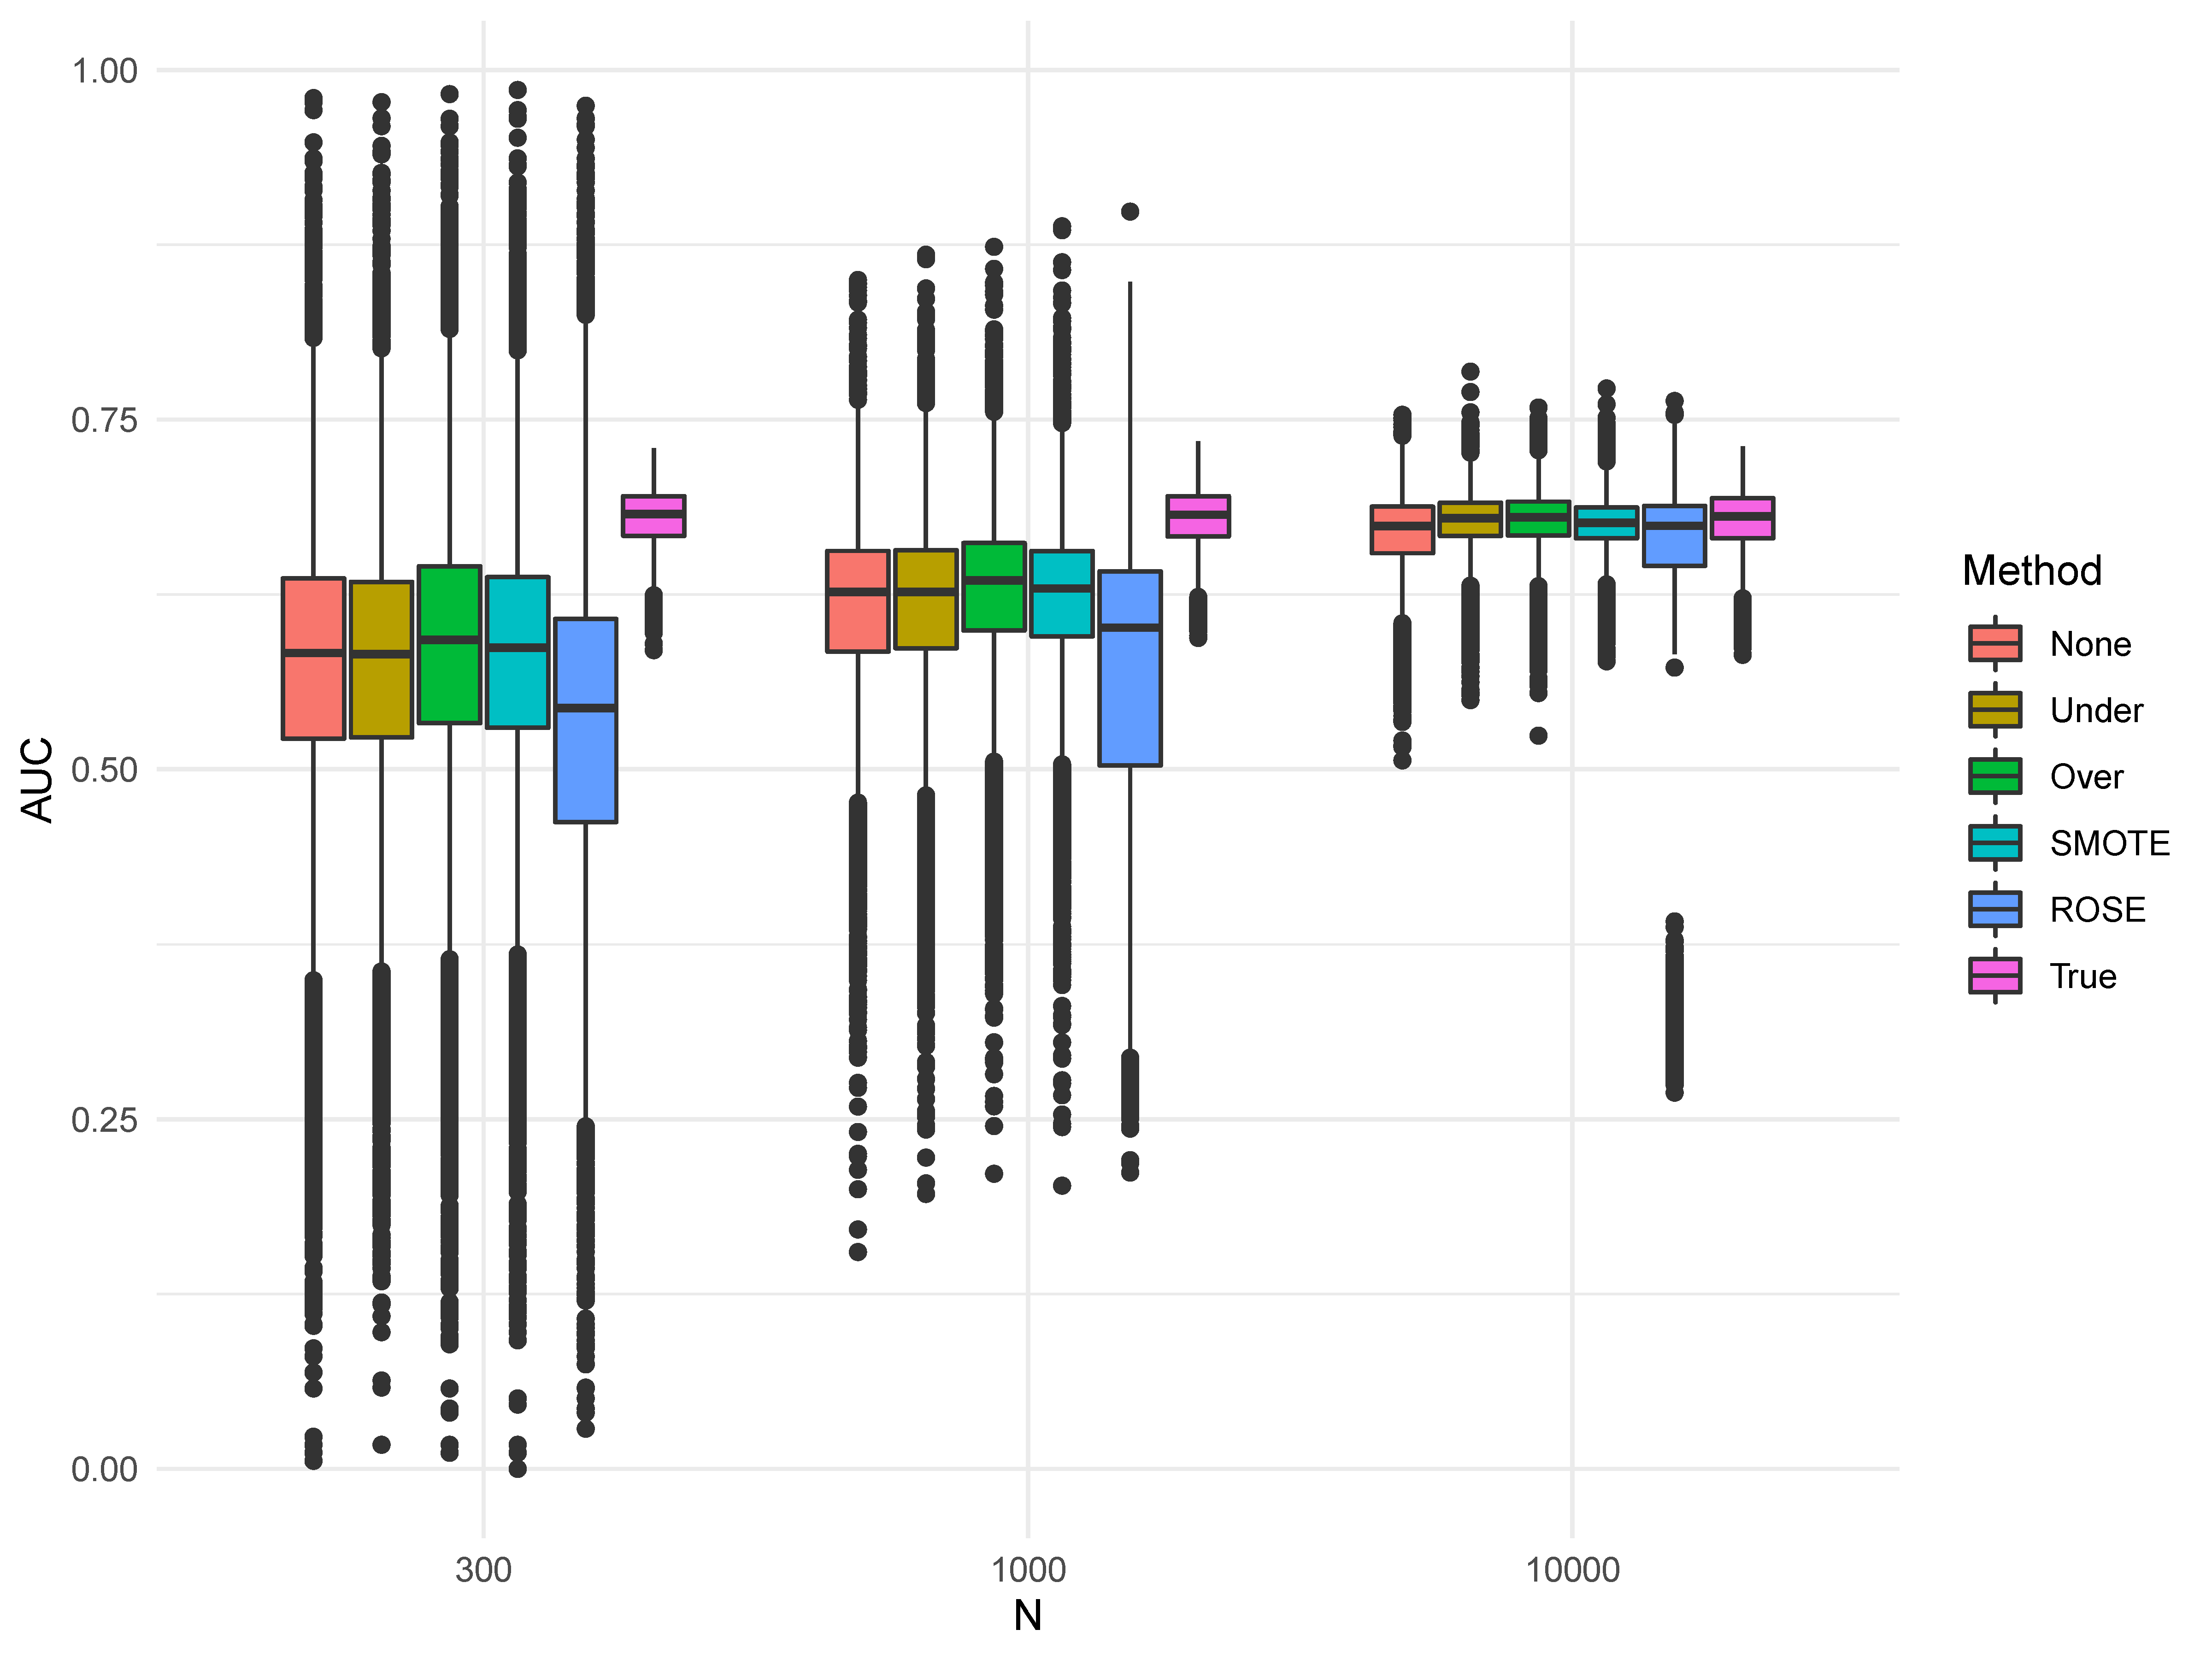
We see similar effects with sample size in Figure 3, as one would expect. Larger sample size resulted in less variability, which further reduced the propensity to over- or under-estimated performance. For the AUC 1, the standard deviations were 0.10 for 300, 0.07 for 1,000, and 0.07 for 10,000. While a large number of AUC values for each of the sampling methods were greater than the True values in the smaller sample, the median values became closer to the True median scores in the larger sample sizes. This highlights improvements in performance and stability with greater N, and a worrisome level of biased outliers at small sample sizes.
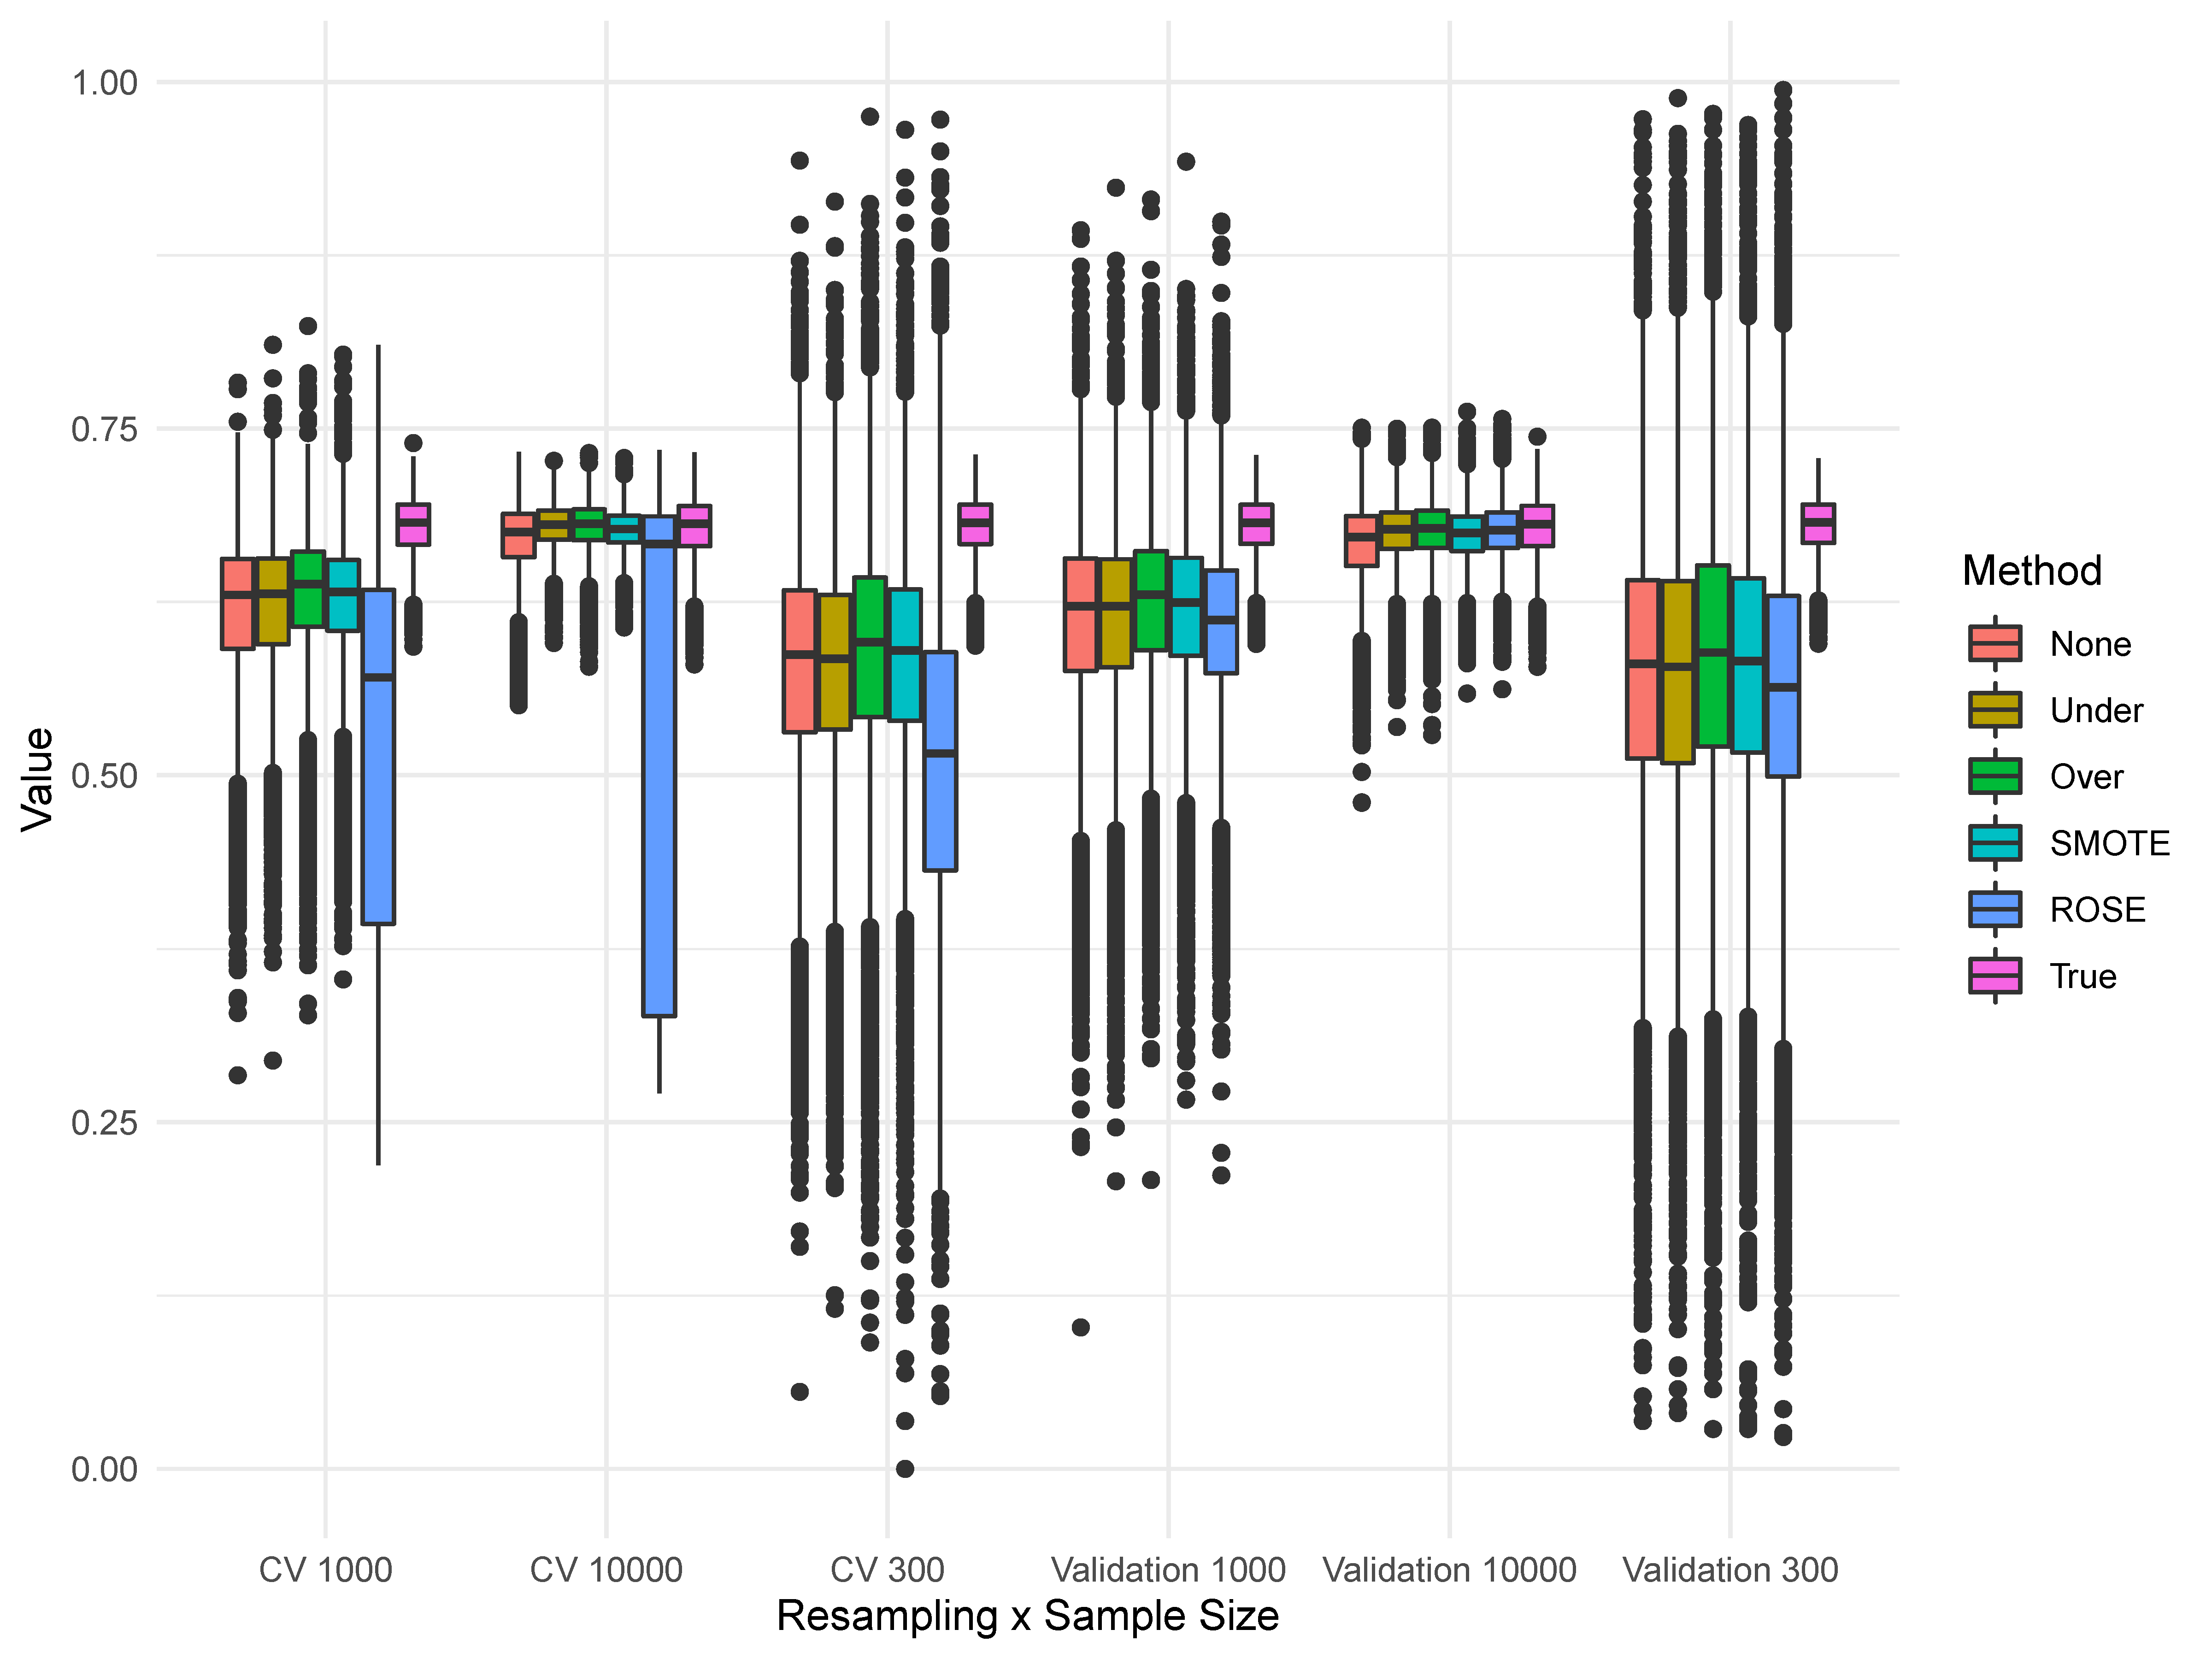
Figure 4 displays the AUC values across both k-fold CV and validation set strategies, as well as using random forests and logistic regression. The first thing to note is the differences in variability across resampling methods, with k-fold CV having lower variance, particularly at a sample size of 300. This is in line with general recommendations to only use the validation set strategy in the presence of large sample sizes (i.e., James, Witten, Hastie, & Tibshirani, 2013). Secondly, there do not seem to be mean differences across resampling methods, and only slight improvements due to random forests (as expected). Finally, we can see a strange interaction between the use of ROSE with k-fold CV, resulting in markedly worse performance.
There was no form of sampling that resulted in universal best performance, but some general trends emerged. In line with prior research, some form of sampling generally outperformed no sampling. For both the linear and nonlinear simulated data, OVER had higher AUC values by 0.01 across conditions, which held even when imbalance was at its highest ($b_0 = -4$) and a sample size of 300. Further, OVER and SMOTE consistently performed the best, with no statistical difference in their results averaged across conditions. For instance, when the intercept was -4, OVER had a median AUPRC of 0.057, SMOTE of 0.058, while no sampling was 0.052. It is important to note however that there was more variability within each type of sampling than between methods. Of note, there was not a notable distinction in the amount of performance variance across sampling methods: unfortunately, all sampling methods evidenced a large degree of variability when the sample size was small (Figure 3) or there was high class imbalance (Figure 2). Finally, ROSE performed the worst among the sampling methods, which was primarily due to problems in integrating ROSE with logistic regression and k-fold CV as seen in Figure 4.
A surprising finding was that there were very little differences in the variability between the use of logistic regression and random forests. Random forests performed better than logistic regression, as expected given the two nonlinear effects, but importantly random forests did not have a greater propensity to overfit than logistic across the conditions and sampling methods.
Data for Study 2 comes from the National Survey on Drug Use and Health from 2014 (NSDUH; Abuse & Administration., n.d.). This survey focused on assessing the use of illicit drugs, alcohol, and tobacco among U.S. civilians 12 years or older. For the purpose of our analysis, we focused on questions that assessed mental health issues. With a sample size of 55,271 and 3,148 variables, the dataset was pared down from the original dataset to just include thirty-nine predictors with the aim of predicting suicidal ideation (last 12 months; SUICTHINK). Predictors included symptoms of depression and other mental health disorders, the impact of these symptoms on daily functioning, and four demographic variables (gender, ethnicity, relationship status, age; dummy coded). The dataset can be freely downloaded from https://www.datafiles.samhsa.gov/study-dataset/national-survey-drug-use-and-health-2014-nsduh-2014-ds0001-nid16876.
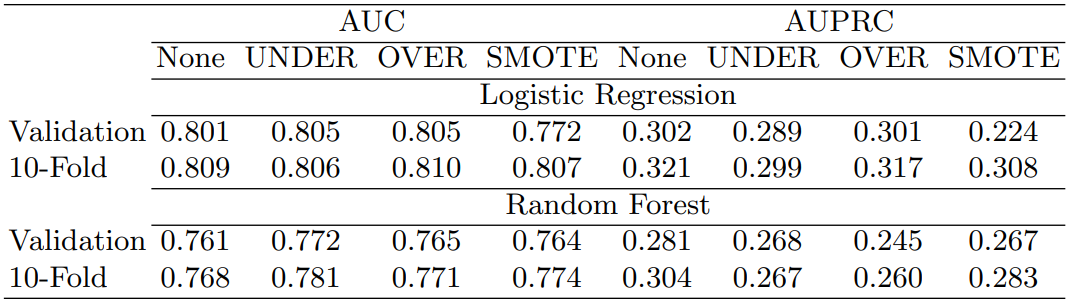
For the analysis, we used Bayesian logistic regression and random forests, while testing all of the above forms of handling imbalance. Secondly, we detail both the AUPRC and AUC given that the outcome variable had only 3.7% positive cases. Additionally, we separate the results by whether the sampling method for handling imbalance paired with the validation set approach or 10-fold CV. Finally, we do not report the results using ROSE given its poor performance in the simulation.
As seen in Table 1, almost uniformly, the AUC and AUPRC values were higher when using 10-fold CV as opposed to the validation set approach, highlighting again that when comparing results across algorithms the same resampling strategy should be used. In assessing the AUC, OVER sampling performed slightly better than no sampling, while the opposite was true for the AUPRC. In fact, no sampling had the highest AUPRC values. In digging deeper to the simulation results, at a sample size of 10,000, there were no statistical differences across the sampling methods for the AUPRC, with a similar lack of distinction even at smaller sample sizes. This empirical example further highlights that at large sample sizes, the use of sampling methods matters less, particularly when using the AUPRC.
This paper addressed a number of decision points that psychological researchers face when analyzing outcomes that exhibit imbalance. These decision points are particularly relevant when applying machine learning, as the importance of cross-validation and the accurate testing of hyperparameters become increasingly important. With this, there were a number of key takeaways:
k-fold CV should be preferred to the validation set approach when using sampling methods to address class imbalance.
The AUC did not demonstrate a bias in the presence of imbalance when using as an overall metric of fit (as opposed to examining the ROC curve).
While OVER, UNDER, and SMOTE sampling approaches demonstrated improvements of no sampling, these improvements were extremely small.
The use of sampling did not increase the propensity to overfit, even when paired with random forests.
The ROSE method should not be used.
Simple models such as logistic regression may outperform complex machine learning algorithms in predicting psychological phenomena (i.e., Jacobucci & Grimm, 2020).
Additionally, although the use of sampling can improve mean/median estimates of performance in the presence of imbalance, there were not meaningful reductions in variability to the performance estimates. This finding would not have been identified by following the standard use of benchmark datasets, and is only possible through the use of simulation.
While this study was able to answer a number of questions, there are some important limitations. The first is that the data was simulated in a relatively simple way, following a logistic link with standard normal variables. Therefore, there remains uncertainty as to how the methods perform with datasets that exhibit levels of complexity falling in between our simulated data approach and the benchmark datasets commonly used to test the sampling approaches. A second limitation is that we only tested the sampling approaches that are easily applied using the caret package in R, while prior research has found performance improvements in a number of more recently developed approaches, particularly generalizations of SMOTE. While R users can write their own functions implementing the additional varieties of SMOTE to be paired with caret, this is unlikely to occur in the majority of psychological applications.
Abuse, S., & Administration., M. H. S. (n.d.). National survey on drug use and health. Retrieved from http://www.samhsa.gov/data/population-data-nsduh/reports(accessedJuly28,2015).
Bajer, D., Zonc, B., Dudjak, M., & Martinovic, G. (2019). Performance analysis of smote-based oversampling techniques when dealing with data imbalance. 2019 International Conference on Systems, Signals and Image Processing (IWSSIP), 265-271. doi: https://doi.org/10.1109/IWSSIP.2019.8787306
Batista, G. E. A. P. A., Prati, R. C., & Monard, M. C. (2004). A study of the behavior of several methods for balancing machine learning training data. SIGKDD Explor. Newsl., 6(1), 20–29. doi: https://doi.org/10.1145/1007730.1007735
Breiman, L. (2001). Random forests. Machine Learning, 45(1), 5-32. doi: https://doi.org/10.1023/A:1010933404324
Buda, M., Maki, A., & Mazurowski, M. A. (2018). A systematic study of the class imbalance problem in convolutional neural networks. Neural Networks, 106, 249-259. doi: https://doi.org/10.1016/j.neunet.2018.07.011
Chawla, N. V., Bowyer, K. W., Hall, L. O., & Kegelmeyer, W. P. (2002). Smote: Synthetic minority over-sampling technique. J. Artif. Int. Res., 16(1), 321–357. doi: https://doi.org/10.1613/jair.953
Christodoulou, E., Ma, J., Collins, G., Steyerberg, E., Verbakel, J., & Van Calster, B. (2019). A systematic review shows no performance benefit of machine learning over logistic regression for clinical prediction models. Journal of Clinical Epidemiology, 110. doi: https://doi.org/10.1016/j.jclinepi.2019.02.004
Demir, S., & Şahin, E. K. (2022). Evaluation of oversampling methods (over, smote, and rose) in classifying soil liquefaction dataset based on svm, rf, and naïve bayes. Avrupa Bilim ve Teknoloji Dergisi(34), 142 - 147. doi: https://doi.org/10.31590/ejosat.1077867
García, V., Sánchez, J., Marqués, A., Florencia, R., & Rivera, G. (2020). Understanding the apparent superiority of over-sampling through an analysis of local information for class-imbalanced data. Expert systems with applications, 158, 113026. doi: https://doi.org/10.1016/j.eswa.2019.113026
Hanley, J. A., & McNeil, B. J. (1982). The meaning and use of the area under a receiver operating characteristic (roc) curve. Radiology, 143(1), 29-36. doi: https://doi.org/10.1148/radiology.143.1.7063747
He, H., & Garcia, E. A. (2009). Learning from imbalanced data. IEEE Transactions on Knowledge and Data Engineering, 21(9), 1263-1284. doi: https://doi.org/10.1109/TKDE.2008.239
Jacobucci, R., & Grimm, K. J. (2020). Machine learning and psychological research: The unexplored effect of measurement. Perspectives on Psychological Science, 15(3), 809-816. (PMID: 32348703) doi: https://doi.org/10.1177/1745691620902467
Jacobucci, R., Littlefield, A. K., Millner, A. J., Kleiman, E. M., & Steinley, D. (2021). Evidence of inflated prediction performance: A commentary on machine learning and suicide research. Clinical Psychological Science, 9(1), 129-134. doi: https://doi.org/10.1177/2167702620954216
James, G., Witten, D., Hastie, T., & Tibshirani, R. (2013). An introduction to statistical learning: With applications in r (Vol. 103). New York: Springer. doi: https://doi.org/10.1007/978-1-4614-7138-7
King, G., & Zeng, L. (2001). Logistic regression in rare events data. Political Analysis, 9, 137–163. doi: https://doi.org/10.1093/oxfordjournals.pan.a004868
Kovács, G. (2019). An empirical comparison and evaluation of minority oversampling techniques on a large number of imbalanced datasets. Applied soft computing, 83, 105662. doi: https://doi.org/10.1016/j.asoc.2019.105662
Kuhn, M. (2008). Building predictive models in r using the caret package. Journal of statistical software, 28(5). doi: https://doi.org/10.18637/jss.v028.i05
Lobo, J. M., Jiménez-Valverde, A., & Real, R. (2008). Auc: a misleading measure of the performance of predictive distribution models. Global ecology and biogeography, 17(2), 145–151. doi: https://doi.org/10.1111/j.1466-8238.2007.00358.x
Lunardon, N., Menardi, G., & Torelli, N. (2014). Rose: a package for binary imbalanced learning. The R journal, 6(1), 79. doi: https://doi.org/10.32614/RJ-2014-008
McCarthy, K., Zabar, B., & Weiss, G. (2005). Does cost-sensitive learning beat sampling for classifying rare classes? In Conference on knowledge discovery in data: Proceedings of the 1st international workshop on utility-based data mining; 21-21 aug. 2005 (pp. 69–77). ACM. doi: https://doi.org/10.1145/1089827.1089836
Menardi, G., & Torelli, N. (2012). Training and assessing classification rules with imbalanced data. Data mining and knowledge discovery, 28(1), 92–122. doi: https://doi.org/10.1007/s10618-012-0295-5
Mitchell, S. M., Cero, I., Littlefield, A. K., & Brown, S. L. (2021). Using categorical data analyses in suicide research: Considering clinical utility and practicality. Suicide & life-threatening behavior, 51(1), 76–87. doi: https://doi.org/10.1111/sltb.12670
Nnamoko, N., & Korkontzelos, I. (2020). Efficient treatment of outliers and class imbalance for diabetes prediction. Artificial intelligence in medicine, 104, 101815–101815. doi: https://doi.org/10.1016/j.artmed.2020.101815
Peduzzi, P., Concato, J., Kemper, E., Holford, T. R., & Feinstein, A. R. (1996). A simulation study of the number of events per variable in logistic regression analysis. Journal of clinical epidemiology, 49(12), 1373–1379. doi: https://doi.org/10.1016/s0895-4356(96)00236-3
Prusty, M. R., Jayanthi, T., & Velusamy, K. (2017). Weighted-smote: A modification to smote for event classification in sodium cooled fast reactors. Progress in nuclear energy (New series), 100, 355–364. doi: https://doi.org/10.1016/j.pnucene.2017.07.015
Saito, T., & Rehmsmeier, M. (2015). The precision-recall plot is more informative than the roc plot when evaluating binary classifiers on imbalanced datasets. PloS one, 10(3), e0118432–e0118432. doi: https://doi.org/10.1371/journal.pone.0118432
Shin, J., Yoon, S., Kim, Y., Kim, T., Go, B., & Cha, Y. (2021). Effects of class imbalance on resampling and ensemble learning for improved prediction of cyanobacteria blooms. Ecological informatics, 61, 101202. doi: https://doi.org/10.1016/j.ecoinf.2020.101202
Torgo, L. (2010). Data mining with r, learning with case studies. Chapman and Hall/CRC. doi: https://doi.org/10.1201/9780429292859
Vabalas, A., Gowen, E., Poliakoff, E., & Casson, A. J. (2019). Machine learning algorithm validation with a limited sample size. PloS one, 14(11), e0224365–e0224365. doi: https://doi.org/10.1371/journal.pone.0224365
Vandewiele, G., Dehaene, I., Kovács, G., Sterckx, L., Janssens, O., Ongenae, F., … Demeester, T. (2021). Overly optimistic prediction results on imbalanced data: a case study of flaws and benefits when applying over-sampling. Artificial Intelligence in Medicine, 111, 101987. doi: https://doi.org/https://doi.org/10.1016/j.artmed.2020.101987
Zhu, B., Baesens, B., & vanden Broucke, S. K. (2017). An empirical comparison of techniques for the class imbalance problem in churn prediction. Information sciences, 408, 84–99. doi: https://doi.org/10.1016/j.ins.2017.04.015
1 We don’t report the standard deviations for the AUPRC as there were floor effects.