Keywords: Careless responding · Daily diary · Intensive longitudinal data · Adolescents · Attention checks
Intensive longitudinal data (ILD) collection involves repeated measurements over many time points from many individuals. It has become increasingly popular in psychology and behavioral research (Laurenceau, DiGiovanni, & Bolger, 2026; Yip, Wang, & Zhao, 2025), because ILD can help study intraindividual dynamic processes and interindividual differences in them (Hamaker & Wichers, 2017; Wang, Hamaker, & Bergeman, 2012). The feasibility of ILD collection has quickly grown with the development of mobile devices, such as smartphones and wearables. Study designs such as experience sampling methods (ESM), ecological momentary assessments (EMA), and daily diaries are often used to collect ILD in daily life, offering improved ecological validity and reduced recall biases compared to conventional study designs (Bolger & Laurenceau, 2013; Laurenceau et al., 2026; Mehl & Conner, 2012; Yip et al., 2025). Focusing on daily diary studies, a search for "daily diary" in article abstracts using the PsycInfo database yielded 1670 peer-reviewed publications from 2006 to 2015, with the number rising to 3236 between 2016 and 2025. When "adolescent" or "youth" was added to the search criteria, the number of articles increased from 175 in 200-2015 to 465 in 201-2025. Therefore, daily diary designs have been increasingly used to study daily dynamics in adolescent research.
When collecting daily dairy data, surveys are often administered online through mobile devices for convenience and real-time data collection. However, online surveys are prone to careless responding (Ward & Meade, 2023) and thus data quality can be compromised (Meade & Craig, 2012). Careless responding refers to "responding without regard to item content" (Meade & Craig, 2012, p. 437). It can occur when participants fail to understand item content, pay insufficient attention to item content, or lack motivation to participate in the survey (Meade & Craig, 2012). In the extant literature, careless responding has been studied mostly in the cross-sectional study design and adult population context. In this study, we provided firsthand results on the prevalence, trends, and baseline correlates of careless responding as well as the impact of careless responding on longitudinal data analyses using real adolescent daily diary data.
When careless responding occurs, observed responses may not accurately reflect true levels of the construct being measured (Ward & Meade, 2023). Jones et al. (2022) reviewed 48 cross-sectional studies on alcohol research with crowdsourcing data and found that the average prevalence rate of careless responding was 11.7% (95% CI: 7.6%, 16.5%). Across different research fields such as psychology and business, reported careless responding rates have widely ranged from 1% to 50% (Ward & Meade, 2023). Prior research has shown that careless responding can lead to psychometric issues such as lowered reliabilities, misleading statistical findings such as deflated or inflated correlation estimates (Kam & Meyer, 2015; Stosic et al., 2024), and incorrect hypothesis testing results (Huang, Bowling, Liu, & Li, 2015; Ward & Meade, 2023). For example, Stosic et al. (2024) demonstrated the inflationary effects of careless responding (e.g., false positives) in psychological research using both simulated and real datasets. Therefore, it is important to accurately identify careless responding and properly handle it in statistical analyses.
Meade and Craig (2012) examined multiple methods for detecting careless responding, including (1) instructed response items or attention check questions (ACQs), (2) response time, (3) self-reported engagement, (4) response consistency or invariability indices, and (5) multivariate outlier analysis. The first three methods are relatively easier to use and considered a priori methods, whereas the last two require data analyses and are viewed as post-hoc methods (Ward & Meade, 2023). First, ACQs are easiest to administer and score for careless responding detection, as the items ask for specific responses (e.g., "Please choose strongly agree for this item"), and there is only one correct response for each item. Second, response time is also easy to record, particularly in online surveys, with very fast responses often assumed to indicate inattention (Meade & Craig, 2012). A commonly used cutoff is two seconds per item, below which responses may be considered careless (Bowling et al., 2016). However, response time varies widely across individuals, introducing ambiguity in scoring. Third, self-reported engagement items (e.g., "I carefully read every survey item.") are also easy to implement and score but are susceptible to response bias, as participants could overstate their attentiveness. Fourth, consistency indices can be computed by the correlations of similar items or constructs, and invariability indices can be computed by the correlations of distinct constructs or the maximum number of consecutive identical responses (called the longstring index). However, defining similar versus distinct constructs and determining appropriate cutoffs can be challenging in practice. Finally, outlier detection methods, such as computing the Mahalanobis distance, have been used for careless responding detection. However, extreme cases may not necessarily indicate careless responding but rather genuine, atypical responses.
In the intensive longitudinal research context, the a priori methods such as ACQs and response time can be easily checked immediately after participants submit their responses and can be used to promptly remind them to respond more carefully. For example, during daily diary data collection, researchers can review ACQ responses and response time on a daily basis and decide whether to message participants when they miss ACQs or respond too fast. In contrast, the post-hoc methods require more complex data analyses and often cannot be done until all data have been collected. As a result, they typically cannot be used to monitor careless responding in real time.
As discussed in Curran (2016) and Ward and Meade (2023), there are no clear guidelines in the literature on how to detect careless responding. Researchers should weigh the pros and cons of each method and use appropriate ones based on their study purposes. Many researchers strongly endorsed ACQs (Curran, 2016; Kam & Chan, 2018; Meade & Craig, 2012). Supporting this, Kung, Kwok, and Brown (2018) investigated whether ACQs threaten scale validity and found no evidence of compromise. Some researchers recommended using multiple methods, such as combining ACQs and response time with post-hoc data analysis screening (Meade & Craig, 2012; Ward & Meade, 2023). In addition, prior research indicated that using response time alone is ineffective in careless responding detection (Kam & Meyer, 2015; Meade & Craig, 2012). Gottfried (2024) analyzed 3298 articles published in 2022 across 200 psychology journals to assess data-quality evaluation practices. The findings revealed that 55% of articles did not employ any data-quality evaluation, 24% used one method, 13% applied two methods, 5% used three methods, and 2% incorporated four or more methods. The most commonly used indicators of data quality were ACQs, nonresponse rates, and response time, although nonresponse rates primarily reflect compliance (completed assessments, compared to scheduled assessments) rather than directly indicating careless responding.
Prior research on careless responding has primarily focused on cross-sectional study designs. There is sparse research on careless responding using empirical intensive longitudinal data, although intensive longitudinal research often involves repeated online surveys and thus careless responding can be a concern. Eisele et al. (2022), a notable exception, conducted an experimental study with 163 college students (mean age \(=21.7\), age range = 18 to 30), examining whether sampling frequency (3, 6, or 9 assessments per day for 14 days) and questionnaire length (30 or 60 items) influenced perceived burden, compliance, and careless responding in an ESM design. Their findings indicated that questionnaire length, but not sampling frequency, was associated with lower momentary self-reported attentiveness and lower compliance. They also included an ACQ as an objective measure of attentiveness, assessed once on Days 3, 6, 9, and 12. Based on the ACQ, they observed a low prevalence rate, with only 10 of the 163 college students failing the item at least once and 3.6% of all responses indicating careless responding. Moreover, this ACQ was related to neither sampling frequency nor questionnaire length.
Recently, modeling methods such as fully exploratory latent Markov mixture factor analysis (e.g., Vogelsmeier, Jongerling, & Ulitzsch, 2025) and screen-time-based mixture models (e.g., Ulitzsch, Nestler, Lüdtke, & Nagy, 2024) have been proposed as post-hoc methods for careless responding detection in intensive longitudinal research. Ulitzsch et al. (2025) applied their screen-time-based mixture models to the ESM data in Eisele et al. (2022). They found that sampling frequency, but not questionnaire length, impacted careless responding. They did not find significant relations of model-implied careless responding to ACQ responses, momentary self-reported attentiveness, or compliance. These findings were contrary to their hypotheses and different from the original analysis results from Eisele et al. (2022), indicating that the results were sensitive to modeling methods and assumptions. Ulitzsch et al. (2025) acknowledged their employed method rested on "theoretically plausible, untested assumptions, for instance regarding the temporal form of changes in attentive response times, and the independence of inattentive screen times from person and occasion characteristics" (p. 356). Furthermore, there may be practical challenges in applying the newly developed models to detect careless responding. That is, the model specifications involve combinations of complex statistical modeling such as mixture modeling, factor analysis or item response theory modeling, and dynamic modeling, making applications challenging for applied researchers.
Research on compliance in intensive longitudinal studies is more extensive than research on careless responding (e.g., Yang, Schick, Sullivan, & Weiss, 2024). Three meta-analyses (Heron, Everhardt, McHale, & Smyth, 2017; van Roekel, Keijsers, & Chung, 2019; Wen, Schneider, Stone, & Spruijt-Metz, 2017) examined compliance in EMA studies focusing on child or adolescent samples. The pooled compliance rates were 76% (23 studies, range = 51% to 92%), 74% (19 studies, range = 51.6% to 92.0%), and 78.3% (36 studies, range = 54.6% to 96.2%). In addition, Jones et al. (2019) conducted a meta-analysis of 126 EMA studies in substance use research (mean age = 28.9, age range = 12.5 to 52.0) and reported a pooled compliance rate of 75.1% (range = 40-45% to above 95%). More recently, Wrzus and Neubauer (2023) analyzed 496 EMA samples (mean age = 31.5, age range = 4.5 to 71.4) and found an average compliance rate of 79% (range = 9.8% to 101.9%; some participants continued answering EMA questions after the scheduled number of days). When considering only the 56 EMA samples with adolescent participants, the average compliance rate was around 75%. Across these meta-analyses, researchers found that neither age nor the total number of assessments was related to compliance rates. Wrzus and Neubauer (2023) emphasized the need for further research on careless responding in longitudinal research contexts.
Many studies have examined correlates of careless responding, primarily using cross-sectional data from college student or community adult samples. For example, personality traits such as conscientiousness and agreeableness as well as emotional stability were found to be negatively related to careless responding (Bowling et al., 2016), while environmental distractions (e.g., the presence of other people, TV, or music during survey completion) were positively related to careless responding (Meade & Craig, 2012). However, little research has examined baseline survey correlates (e.g., age, emotion regulation, and neighborhood environment) of momentary careless responding in intensive longitudinal designs, particularly among adolescent or youth populations.
As reviewed above, prior research has provided valuable insights into careless responding primarily in cross-sectional or adult population research contexts. Despite these notable contributions, there are still research gaps. First, although very low prevalence rates of careless responding based on ACQs were observed for college students (e.g., Eisele et al., 2022), prevalence rates and trends of careless responding over repeated assessments (e.g., across days) remain unknown in adolescent or youth samples. Second, the two second per item rule for response time screening was developed for cross-sectional studies (Bowling et al., 2016); its performance in daily diary research has not been examined previously. Third, although correlates of careless responding have been extensively studied using cross-sectional designs (e.g., Bowling et al., 2016), correlates of careless responding have been sparsely studied using empirical adolescent longitudinal data. Fourth, Stosic et al. (2024) observed inflationary effects of careless responding in cross-sectional data analyses; the impact of careless responding on longitudinal data analyses remained to be explored.
No prior research has examined the prevalence, correlates, and impact of careless responding in youth populations using empirical daily diary data, although daily diary surveys have been widely used to study adolescent health (Yip et al., 2025). Daily diary designs are increasingly employed in adolescent research, making the examination of data quality in adolescent daily diary studies crucial. To our knowledge, this is the first study to systematically examine careless responding in an adolescent population using empirical daily diary data. Specifically, our study investigated the prevalence and trends of careless responding over days in an adolescent population, along with its potential correlates and impact on longitudinal data analyses. We also examined the compliance rates of adolescent daily diary data collection. We analyzed multilevel data from a 21-day daily diary study with 311 Mexican-origin youth (ages 12-16). Each day, participants completed two ACQs and their response times were recorded. As discussed earlier, ACQs and response time screening are a priori and most practical methods for careless responding detection (Gottfried, 2024), making them well-suited for addressing our research questions. Moreover, by examining these frequently used measures such as ACQs and response time in youth samples, our findings provide empirical-data-based recommendations for evaluating data quality in future adolescent intensive longitudinal research.
The remainder of this article is structured as follows. First, we describe the daily diary study, including participants, procedures, careless responding measures, and baseline survey variables. Next, we examine the compliance and careless responding prevalence rates and analyze correlates of careless responding. We then investigate trends of careless responding over time. Finally, we evaluate the impact of careless responding on multilevel longitudinal analyses. We end the article by discussing implications of the findings, recommendations, and directions for future research.
The daily diary and baseline survey data are from Wave 1 of the Seguimos Avanzando study, a three-wave longitudinal study examining the associations between discrimination-related stressors and mental health and sleep outcomes among Latinx youth (Alegría et al., 2026, 2024; Park et al., 2024; Valentino et al., 2025).
A sample of 344 youths of Mexican descent, aged 12-16 (\(M=13.5\), \(SD=1.1\); 178 males, 158 females, 8 non-binary/third gender), participated in the Wave 1 (baseline) survey. Of these, 311 (\(M_{age}=13.5\) years, \(SD=1.1\); 158 males, 146 females, 7 non-binary/third gender) participated in a 21-day daily diary survey immediately following their Wave 1 surveys.
Both the Wave 1 survey and the daily diary surveys were programmed in Qualtrics and administered in the participant's preferred language (English or Spanish). The Wave 1 survey was conducted either in-person (74.7%) or virtually (25.3%), while the daily diary surveys were administered all online. Youth were instructed to complete the daily diary survey each night between 6:00 PM and 2:00 AM. They received a survey link via e-mail or text message at 6:00 PM and had one hour to complete it after clicking the link. If unfinished, a reminder was sent at 10:00 PM. Youths were compensated $3 per completed daily survey, plus a bonus of $5 for completing each full week and an additional $10 for completing all 21 days ($88 total). Additionally, each youth received $30 for completing the Wave 1 survey.
Every daily diary survey included two ACQs, in the form of instructed response items, were administered using a 7-point Likert-type scale. The first (ACQ1) was: You're doing a great job! Just so we know you are still paying attention, can you please select "Strongly agree" below? The second (ACQ2) was: You're doing a great job! Just so we know you are still paying attention, can you please select "Strongly disagree" below? Response options ranged from 1 for "Strongly agree" to 7 for "Strongly disagree" for both ACQs. These ACQs were placed as items 19 and 45 out of 55 in the questionnaire.
There was no monetary penalty to fail the ACQs, and participants still received the compensation if they completed the daily survey even though they did not pass one or both ACQs. When participants did not respond to an ACQ, we treated the ACQ response to be missing.
At the daily level, two time-varying variables, ACQ1P and ACQ2P, were computed to record whether each youth correctly answered each ACQ on a given day (0 = fail or missing response; 1 = pass). Two person-level measures were then computed for each youth to record the frequencies of passing or failing the ACQs: the total number of days passing ACQ1 (ACQ1PDAYS) and the total number of days passing ACQ2 (ACQ2PDAYS). To control for individual differences in compliance (quantified by the number of daily surveys they completed, OBSDAYS), we also computed the proportion of days each youth passed the ACQs (ACQ1PRATE = ACQ1PDAYS/OBSDAYS; ACQ2PRATE = ACQ2PDAYS/OBSDAYS). Additionally, binary indicators (ACQ1PALL and ACQ2PALL) were created to determine whether a youth consistently passed each ACQ across all completed diary days (0 = no, 1 = yes).
To assess response speed, we recorded each participant's daily response time (RT, in minutes). Based on the widely used screening threshold of 2 seconds per item (Bowling et al., 2016), we created a binary daily-level variable indicating whether a youth passed the response time screening (RTP; 0 = fail if the entire survey response time is shorter than 110 seconds or 1.83 minutes for the entire survey of 55 items, otherwise 1 = pass). At the person level, we computed the intraindividual mean response time (RTIM) as the average time spent completing daily surveys for each youth. Additionally, we calculated three other RT-based person-level statistics for each youth: (1) the number of days they passed the RT screening (RTPDAYS), (2) the proportion of days they passed (RTPRATE = RTPDAYS/OBSDAYS), and (3) whether they consistently passed the RT screening on all completed diary days (RTPALL; 0 = no, 1 = yes).
Prior research found that personality such as conscientiousness and emotional stability were negatively related to, and environmental distractions were positively related to careless responding (Bowling et al., 2016; Meade & Craig, 2012). Since personality was not assessed in the Seguimos Avanzando study, we examined several youth-reported baseline survey measures as potential correlates of careless responding in the daily diary component of the study. They are: youth demographics (age; gender: 0 = male, 1= female and nonbinary), emotion stability (state anger, trait anger, and anger control; Brunner & Spielberger, 2009), emotion regulation - cognitive appraisal (EQRCR; Gross & John, 2003), and environment (neighborhood characteristics; Loeber, Farrington, Stouthamer-Loeber, & Van Kammen, 1998). The reliability estimates (\(\omega \)) of these measures ranged from .81 to .87, except for emotion regulation - cognitive appraisal (\(\omega \) = .69; Alegría et al., 2024).
To demonstrate the impact of careless responding on longitudinal data analysis results, we used data from four daily-level variables. They are: negative affect (NA; Watson, Clark, & Tellegen, 1988) and perceived stress (STRESS; Cohen, Kamarck, & Mermelstein, 1983) as time-varying outcomes, and racial/ethnic discrimination (RED; Feng, Cheon, Yip, & Cham, 2021) and last night's sleep latency (SLEEPL, measured by a single item; Last night, how long [in minutes] did it take you to fall asleep? 1: 0-5 minutes; 2: -10 minutes; 3: 11-15 minutes; 4: 16+ minutes) as time-varying predictors. The between-youth reliability estimates of NA, STRESS, and RED were 0.83, 0.74, and 0.73, and the within-youth reliability estimates were 0.71, 0.56, and 0.69, respectively. We selected these example variables because their relations can be of substantive research interest.
The overall compliance rate, averaged across days and youths, was 75.1%. Among the 311 youths who participated in the daily diary surveys, more than half (\(n=162\), 52.1%) completed at least 18 days of daily diaries and 232 (74.6%) youths completed at least 14 days. Furthermore, 50 (16.1%) completed 7 to 13 days, 10 (3.2%) completed 4 to 6 days, and 19 (6.1%) completed 3 or fewer days of daily dairies.
The overall average rates of passing ACQ1 and ACQ2, averaged across days and youths, were 93.4% and 81.9%, respectively. Table 1 displays the distribution of passing rates for each careless responding screening method. Among the 311 youths, 183 (58.8%) passed ACQ1, 172 (55.3%) passed ACQ2, and 132 (42.4%) passed both ACQs on all of the days they provided daily diaries. In addition, 275 youths (88.4%) passed ACQ1, and 237 youths (76.2%) passed ACQ2 for at least 80% of the days they completed daily diaries. In contrast, 13 youths (4.2%) passed ACQ1 and 52 youths (16.7%) passed ACQ2 for fewer than 50% of the days they provided daily diaries.
| Pass rates | ACQ1
| ACQ2
| RT screening
| |||
| (%) | N | Percent | N | Percent | N | Percent |
| 0 | 6 | 1.93 | 38 | 12.22 | 0 | 0.00 |
| 0.01 to 9.99 | 0 | 0.00 | 0 | 0.00 | 0 | 0.00 |
| 10 to 19.99 | 0 | 0.00 | 3 | 0.96 | 0 | 0.00 |
| 20 to 29.99 | 0 | 0.00 | 6 | 1.93 | 0 | 0.00 |
| 30 to 39.99 | 3 | 0.96 | 3 | 0.96 | 1 | 0.32 |
| 40 to 49.99 | 4 | 1.28 | 2 | 0.64 | 1 | 0.32 |
| 50 to 59.99 | 5 | 1.60 | 7 | 2.24 | 7 | 2.24 |
| 60 to 69.99 | 9 | 2.89 | 10 | 3.21 | 5 | 1.60 |
| 70 to 79.99 | 9 | 2.89 | 5 | 1.60 | 5 | 1.60 |
| 80 to 89.99 | 28 | 8.99 | 24 | 7.71 | 16 | 5.13 |
| 90 to 99.99 | 64 | 20.57 | 41 | 13.18 | 47 | 15.09 |
| 100 | 183 | 58.84 | 172 | 55.31 | 229 | 73.63 |
Note. The passing rates were calculated as the proportions of days a participant passing the screening methods, with ACQ1PRATE = ACQ1PDAYS/OBSDAYS, ACQ2PRATE = ACQ2PDAYS/OBSDAYS, and RTPRATE = RTPDAYS/OBSDAYS respectively.
Table 2 presents the sample means, standard deviations, and correlations of the person-level ACQ- or RT-related measures. The average number of days youths participated in the 21-day daily diary study was 15.76 (\(SD=5.42\)). On average, youths had more days of passing ACQ1 (\(M=14.72\) days, \(SD=5.82\)) than passing ACQ2 (\(M=12.90\) days, \(SD=7.31\)). A dependent-sample t-test indicated that the mean difference was significant (\(M_{diff}=1.82\) days, \(SD_{diff}=5.44\), \(t=5.90\), \(p<0.001\)), with a Cohen's \(d=0.33\). On average, youths also had a higher proportion of days passing ACQ1 (\(M_{rate}=92\%\), \(SD=0.18\)) than passing ACQ2 (\(M_{rate}=80\%\), \(SD=0.34\)). The mean difference was significant (\(M_{diff}=12\%\), \(SD_{diff}=0.33\), \(t=6.30\), \(p<0.001\)), with a Cohen's \(d=0.36\).
| Mean | SD | 1 | 2 | 3 | 4 | 5 | 6 | 7 | |
| 1. OBSDAYS | 15.76 | 5.42 | |||||||
| 2. ACQ1PDAYS | 14.72 | 5.82 | .91*** | ||||||
| 3. ACQ2PDAYS | 12.90 | 7.31 | .66*** | .68*** | |||||
| 4. ACQ1PRATE | 0.92 | 0.18 | .28*** | .59*** | .35*** | ||||
| 5. ACQ2PRATE | 0.80 | 0.34 | .16** | .25*** | .79*** | .36*** | |||
| 6. RTPDAYS | 15.22 | 5.48 | .97*** | .92*** | .65*** | .34*** | .18*** | ||
| 7. RTPRATE | 0.96 | 0.11 | .23*** | .32*** | .21*** | .47*** | .24*** | .41*** | |
| 8. RTIM | 7.02 | 4.13 | -.23*** | -.20*** | -.19*** | -.07 | -.12* | -.17*** | .11* |
Note. ***\(p<0.005\); **\(p<0.01\); *\(p<0.05\). OBSDAYS: the number of completed daily surveys; ACQ1PDAYS: the number of days passing ACQ1; ACQ2PDAYS: the number of days passing ACQ2; ACQ1RATE (=ACQ1PDAYS/OBSDAYS): the proportion of days passing ACQ1; ACQ2RATE (=ACQ2PDAYS/OBSDAYS): the proportion of days passing ACQ2; RTPDAYS: the number of days passing response time screening; RTPRATE (=RTPDAYS /OBSDAYS): the proportion of days passing response time screening; RTIM: average response time across days.
As expected, the number of completed daily surveys was highly correlated with the number of days passing ACQ1 (\(r=0.91\), \(p<0.001\)) and ACQ2 (\(r=0.66\), \(p<0.001\)). The number of completed daily surveys was moderately correlated with the proportions of days passing ACQ1 (\(r=0.28\), \(p<0.001\)) and ACQ2 (\(r=0.16\), \(p=0.006\)), indicating that those with higher compliance tended to have higher likelihoods of passing ACQs.
The overall average rate of passing RT screening, averaged across days and youths, was 96.6%. Among the 311 youths, 229 (73.6%) passed RT screening on all of the days they provided daily diaries. In addition, 292 youths (93.9%) passed RT screening for at least 80% of the days they provided daily diaries, whereas 2 (0.6%) passed RT screening for fewer than 50% of the days they provided daily diaries (Table 1). The intraindividual mean response time had an average of 7.02 minutes (\(SD=4.13\)) and was negatively correlated with the number of completed daily surveys (\(r=-0.23\), \(p<0.001\)), indicating that those who with higher compliance tended to complete the daily diaries more slowly. The number of completed daily surveys was very highly correlated with the number of days passing RT screening (\(r=0.97\), \(p<0.001\)). Moreover, the number of completed daily surveys was moderately correlated with the proportion of days passing RT screening (\(r=0.23\), \(p<0.001\)), indicating that those who with higher compliance also tended to have higher likelihoods of passing RT screening.
The proportion of days passing RT screening was significantly correlated with the proportions of days passing ACQ1 (\(r=0.46\), \(p<0.001\)) and ACQ2 (\(r=0.24\), \(p<0.001\)). The intraindividual mean response time was negatively correlated with the number of days passing ACQ1 (\(r=-0.20\), \(p<0.001\)), the number of days passing ACQ2 (\(r=-0.19\), \(p<0.001\)), and the proportion of days passing ACQ2 (\(r=-0.12\), \(p=0.031\)). The intraindividual mean response time was not significantly correlated with the proportion of days passing ACQ1 (\(r=-0.07\), \(p=0.250\)).
The average number of days youths passed RT screening was 15.22 (\(SD=5.48\)), significantly higher than the average numbers of days passing ACQ1 (\(M_{diff}=0.50\) days, \(SD_{diff}=2.32\), \(t=3.82\), \(p<0.001\), Cohen's \(d=0.22\)) and ACQ2 (\(M_{diff}=2.32\) days, \(SD_{diff}=5.57\), \(t=7.35\), \(p<0.001\), Cohen's \(d=0.42\)). The average proportion of days passing daily RT screenings was 96% (\(SD=.11\)), which was also significantly higher than the average proportions of days passing ACQ1 (\(M_{diff}=4\%\), \(SD_{diff}=0.16\), \(t=4.48\), \(p<0.001\), Cohen's \(d=0.25\)) or ACQ2 (\(M_{diff}=16\%\), \(SD_{diff}=0.34\), \(t=8.27\), \(p<0.001\), Cohen's \(d=0.47\)).
More than 55% of the youths passed ACQ1 or ACQ2, and more than 70% passed RT screening on all of the days they provided daily diaries. As a result, the continuous person-level careless responding measures exhibited a high frequency at their maximum values, resulting in a ceiling effect (Wang, Zhang, McArdle, & Salthouse, 2008). To address this point-mass concentration, we focused on comparing baseline characteristics of youths who consistently passed a screening method over the 21-day study period with those who did not, based on ACQ1 (\(n=183\) vs. \(n=128\)), ACQ2 (\(n=172\) vs. \(n=139\)), and RT screening (\(n=229\) vs. \(n=82\)).
Table 3 presents the comparison results with the mean difference estimates in the baseline youth-reported survey correlates, \(p\) values, and Cohen's \(d\) estimates. First, youths who consistently passed RT screening did not differ significantly from those who did not on the baseline correlates. Second, youth who consistently passed ACQ1 or ACQ2 on all of the days they provided daily diaries, on average, were significantly older (Cohen's \(d=0.32\) or 0.29 respectively), had lower levels of state anger (Cohen's \(d=-0.36\) or -0.24 respectively), and exhibited higher levels of anger control (Cohen's \(d=0.30\) or 0.40 respectively) and emotion regulation - cognitive appraisal (Cohen's \(d=0.37\) or 0.29 respectively), compared to youth who did not consistently pass the ACQs. In addition, youth who consistently passed ACQ1 reported fewer problems (e.g., unemployment, abandoned houses, or assaults and muggings) in their neighborhoods (Cohen's \(d=-0.29\)) than those who did not. Gender and trait anger were not significantly related to consistently passing ACQ1 or ACQ2.
| ACQ1 | ACQ2 | RT screening | ||
|
Age |
Mean Diff | 0.35 | 0.31 | -0.04 |
| p | 0.005 | 0.013 | 0.779 | |
| d | 0.32 | 0.29 | -0.04 | |
|
Gender |
Mean Diff | 0.04 | 0.03 | 0.07 |
| p | 0.495 | 0.588 | 0.265 | |
| d | 0.08 | 0.06 | 0.14 | |
|
State Anger |
Mean Diff | -0.91 | -0.61 | -0.26 |
| p | 0.004 | 0.043 | 0.495 | |
| d | -0.36 | -0.24 | -0.10 | |
|
Trait Anger | Mean Diff | -0.77 | -0.37 | 0.02 |
| p | 0.129 | 0.462 | 0.973 | |
| d | -0.18 | -0.08 | 0.00 | |
|
Anger Control |
Mean Diff | 0.72 | 0.95 | 0.35 |
| p | 0.01 | \(<\) 0.001 | 0.27 | |
| d | 0.30 | 0.40 | 0.14 | |
| Emotion
Regulation -
Cognitive
Appraisal |
Mean Diff | 2.06 | 1.62 | 0.29 |
| p | 0.002 | 0.014 | 0.685 | |
| d | 0.37 | 0.29 | 0.05 | |
| Neighborhood
Characteristics |
Mean Diff | -4.54 | -1.88 | -1.95 |
| p | 0.021 | 0.306 | 0.345 | |
| d | -0.29 | -0.12 | -0.12 | |
Note. Results with \(p\) values less than \(0.05\) were highlighted.
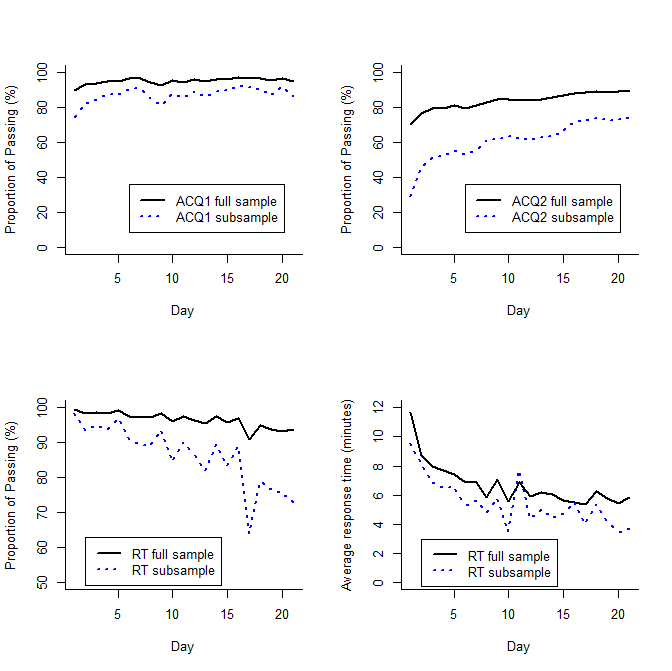
Figure 1 depicts the trends in the proportions of youths passing the ACQs and RT screening, as well as the average response time across days from the full sample (\(n =311\)). On Day 1, the proportions of youths passing ACQ1, ACQ2, and RT screening were 89.5%, 69.9%, and 99.6%, respectively. By Day 21, these proportions became 94.6%, 89.2%, and 93.7%, respectively. The changes in the metrics consistently suggested a practice or learning effect. Additionally, the average response time decreased from 11.6 minutes on Day 1 to 5.8 minutes on Day 21.
To examine changes in the passing rates over days, we focused on participants who did not consistently pass each screening across all days and analyzed respective subsamples (\(n=128\), \(n=139\), and \(n=82\), respectively for ACQ1, ACQ2, and RT screening). The trends in the proportions of participants passing ACQs and the RT screening across days from these three subsamples are also depicted in Figure 1. For the subsamples, the passing proportions on Day 1 were 73.9%, 29.2%, and 98.5% for ACQ1, ACQ2, and RT screening, respectively, whereas the passing proportions on Day 21 became 85.9%, 74.4%, and 72.9% respectively. Furthermore, for the RT subsample, the average response time decreased from 9.5 minutes on Day 1 to 3.8 minutes on Day 21, again demonstrating a practice effect. Overall, the passing proportions for ACQs generally increased over days, with more increases observed in ACQ2 compared to ACQ1. The average response time generally decreased and the passing proportions of RT screening generally declined over the course of the daily diary surveys.
To examine the trends in daily responses to the ACQ and RT screenings over days, generalized latent linear growth curve models (Asparouhov & Muthén, 2021) were fit separately to each of the three subsamples. ACQ1P, ACQ2P, and RTP were separately modeled as time-varying binary outcomes (0 = fail; 1 = pass). Using ACQ1P as an example, the within-person level model can be written as:
\begin {equation} \log \left ( \frac {P[\mathrm {ACQ1P}_{it}=1]} {1-P[\mathrm {ACQ1P}_{it}=1]} \right ) = b_{0i} + b_{1i}(\mathrm {day}_{it}-1) \end {equation} where \(i\) represents youth \(i\), \(t\) represents day \(t\), and \(P[\mathrm {ACQ1P}_{it}=1]\) is the predicted probability of passing ACQ1 for youth \(i\) on day \(t\). \(\exp (b_{1i})\) is the odds ratio of the day effect of youth \(i\), representing the predicted increase in the odds (\(P/[1-P]\)) of passing ACQ1 for a 1-day increase for youth \(i\).
The between-person level model can be written as:
\begin {equation} \begin {aligned} b_{0i} &= b_{00} + u_{0i}, \\ b_{1i} &= b_{10} + u_{1i}. \end {aligned} \end {equation}
The between-person residuals (\(u_{0i}\) and \(u_{1i}\)) are assumed to have means of zeros and freely estimated variances. From this model, inferences can be made about the odds ratio of the day effect for the "average" person in the ACQ1 subsample by estimating and testing \(\exp (b_{10})\) and the between-person variance in the day effect (\(\operatorname {var}(b_{1i})\)). The models were estimated in Mplus using maximum likelihood estimation with the EM algorithm.
For ACQ1, the odds ratio estimate of the day effect for the "average" person in the ACQ1 subsample was statistically significant (odds ratio estimate \(=1.10\), \(p<0.001\); 95% CI: [1.04, 1.16]). The between-person variance in the day effects was also statistically significant (estimate \(=0.02\), \(p=0.013\); 95% CI: [0.005, 0.039]). For ACQ2, the odds ratio estimate of the day effect for the "average" person in the ACQ2 subsample was statistically significant (odds ratio estimate \(=1.97\), \(p<0.001\); 95% CI: [1.55, 2.38]). In addition, the between-person variance in the day effects was statistically significant (estimate \(=0.54\), \(p=0.034\); 95% CI: [0.04, 1.04]). For RT screening, the odds ratio estimate of the day effect for the "average" person in the RT subsample was statistically significant (odds ratio estimate \(=0.89\), \(p<0.001\); 95% CI: [0.86, 0.93]). However, the between-person variance in the day effects was not statistically significant (estimate \(=0.001\), \(p=0.300\); 95% CI: [-0.001, 0.004]). These results indicated that the likelihoods of passing ACQ1 or ACQ2 increased significantly over days, whereas the likelihood of passing RT screening decreased significantly for the "average" persons in each respective subsample. Additionally, there were significant variations across individuals in how their likelihoods of passing ACQ1 and ACQ2 changed over time, but not for RT screening.
When youths failed to pass the daily ACQs and/or RT screenings, the quality of their responses came into question. In this section, we demonstrate the impact of careless responding on statistical conclusions from longitudinal data analyses. We used the following procedure to illustrate the impact: (1) identify the full sample and relevant subsamples using careless responding information (e.g., ACQ and/or RT information); (2) conduct statistical data analyses using data from the full sample and subsamples; and (3) compare results of the data analyses from all samples.
For the full sample, all available daily-level data were used, regardless of whether or not the ACQs or RT screening were passed. We then created four subsamples using information from the two ACQs and response time. Specifically, Subsample 1 consisted of daily responses when the ACQ1 screening was passed (i.e., daily responses were removed if the ACQ1 screening was failed), Subsample 2 consisted of daily responses when the ACQ2 screening was passed (i.e., daily responses were removed if the ACQ2 screening was failed), and Subsample 3 consisted of daily responses when the RT screening was passed (i.e., daily responses were removed if the RT screening was failed). The fourth subsample consisted of daily responses when all three screening methods (ACQ1, ACQ2, and RT) were passed (i.e., daily responses were removed if one or more of the screenings was failed). The full sample had 311 youths and 4902 daily responses, whereas the four subsamples had 305 youths with 4579 daily responses, 273 youths with 4013 daily responses, 311 youths with 4735 responses, and 270 youths with 3773 responses, respectively. When a single screening method was used, ACQ2 screening removed the most daily responses whereas RT screening removed the fewest daily responses.
We used multilevel structural equation models (MSEMs; Asparouhov & Muthén, 2021) as examples of statistical analyses to illustrate the impact of careless responding on longitudinal data analyses. In the MSEMs, the relationship between a daily-level predictor and a daily-level outcome was examined. Two predictors were analyzed separately: daily racial/ethnic discrimination (RED) and sleep latency (SLEEPL). Two outcomes were also analyzed separately: daily negative affect (NA) and daily stress (STRESS). In total, there were four MSEMs, each estimated using data from the full sample and the four subsamples. Latent person-mean centering (Asparouhov & Muthén, 2019) was employed to disaggregate within-person and between-person effects of time-varying predictors (Wang & Maxwell, 2015).
Using RED and NA as an example for illustration, the within-person model can be written as:
\begin {equation} NA_{it} = b_{0i} + b_{1i}(RED_{it}-RED_{i\cdot }) + b_{2i}(day_{it}-1) + e_{it}. \end {equation} \(b_{1i}\) is the within-person effect of RED on NA for youth \(i\) after controlling for the testing effect (effect of day). The between-person model can be written as:
\begin {align} b_{0i} &= b_{00} + b_{01}RED_{i\cdot } + u_{0i}, \\ b_{1i} &= b_{10} + u_{1i}, \\ b_{2i} &= b_{20} + u_{2i}. \end {align}
The parameters of interest are \(b_{01}\) and \(b_{10}\). Specifically, \(b_{01}\) measures the between-person effect of RED on NA, indicating whether youths with higher average levels of daily perceived racial discrimination tend to have higher or lower average levels of negative affect, compared to youths with lower average levels of daily racial/ethnic discrimination. On the other hand, \(b_{10}\) measures the within-person effect of RED on NA for the "average" person, assessing whether negative affect is higher or lower on days when the "average" youth experiences higher levels of racial/ethnic discrimination compared to days when they experience lower levels. Thus, the between-person effects address questions of "who" and the within-person effects address questions of "when." From all four MSEMs, we focus on evaluating eight effects including four between-person effects and four average within-person effects.
The models were estimated in Mplus using Bayesian estimation. Point estimates (medians of the effect posterior distributions) and the 99% credible intervals (rather than 95%, given the large number of effects examined) of the between- and within-person effects were reported in Table 4.
| Between-person effects
| Within-person effects
| |||||
| Est | 0.5% | 99.5% | Est | 0.5% | 99.5% | |
| Perceived racial/ethnic discrimination and negative affect
| ||||||
| Full sample | 2.00 | 1.06 | 2.92 | 0.36 | 0.09 | 0.62 |
| Subsample 1 | 2.16 | 1.17 | 3.16 | 0.39 | 0.10 | 0.67 |
| Subsample 2 | 2.08 | 1.14 | 3.00 | 0.26 | -0.03 | 0.55 |
| Subsample 3 | 2.15 | 1.14 | 3.15 | 0.34 | 0.07 | 0.61 |
| Subsample 4 | 2.09 | 1.15 | 3.03 | 0.28 | -0.04 | 0.59 |
| Perceived racial/ethnic discrimination and stress
| ||||||
| Full sample | 0.52 | 0.09 | 0.97 | 0.12 | 0.01 | 0.22 |
| Subsample 1 | 0.55 | 0.08 | 1.02 | 0.13 | 0.01 | 0.24 |
| Subsample 2 | 0.56 | 0.07 | 1.04 | 0.09 | -0.03 | 0.22 |
| Subsample 3 | 0.56 | 0.10 | 1.02 | 0.12 | 0.01 | 0.23 |
| Subsample 4 | 0.57 | 0.08 | 1.06 | 0.10 | -0.04 | 0.24 |
| Sleep latency and negative affect
| ||||||
| Full sample | 0.48 | 0.00 | 0.97 | 0.16 | 0.03 | 0.29 |
| Subsample 1 | 0.38 | -0.11 | 0.86 | 0.15 | 0.02 | 0.28 |
| Subsample 2 | 0.43 | -0.05 | 0.91 | 0.12 | -0.04 | 0.27 |
| Subsample 3 | 0.46 | -0.01 | 0.94 | 0.16 | 0.03 | 0.29 |
| Subsample 4 | 0.37 | -0.12 | 0.85 | 0.11 | -0.05 | 0.26 |
| Sleep latency and stress
| ||||||
| Full sample | 0.23 | 0.02 | 0.45 | 0.01 | -0.06 | 0.08 |
| Subsample 1 | 0.24 | 0.03 | 0.46 | 0.02 | -0.06 | 0.09 |
| Subsample 2 | 0.22 | -0.02 | 0.47 | 0.00 | -0.08 | 0.08 |
| Subsample 3 | 0.23 | 0.01 | 0.45 | 0.02 | -0.06 | 0.09 |
| Subsample 4 | 0.24 | 0.00 | 0.49 | 0.01 | -0.08 | 0.09 |
Note. Full sample is the sample without removing any careless responding cases; Subsamples 1 -4 are the samples after removing careless responding daily cases based on ACQ1, ACQ2, RT screening, and all three screening methods, respectively. 99% credible intervals that did not cover zero were highlighted.
Comparisons of point estimates from the full sample and subsample analyses revealed no consistent patterns. For example, the point estimate of the between-person effect of sleep latency on negative affect was larger from the full sample analysis (0.48) than those from all subsample analyses (0.37 to 0.46), whereas the point estimate of the between-person effect of perceived discrimination on stress was smaller from the full sample analysis (0.52) than those from all subsample analyses (0.55 to 0.57). Meanwhile, the within-person effect estimates of sleep latency on stress were similar from all analyses (0.00 to 0.02). Overall, these results suggested that when careless responding is not addressed, inflated or deflated effect estimates may be observed.
Regarding statistical testing results, no consistent patterns emerged as well. Three effects had consistent statistical conclusions from all analyses: the between-person effects of perceived discrimination on negative affect or stress (with 99% CIs consistently excluding zero) and the within-person effect of sleep latency on stress (with 99% CIs consistently including zero). Thus, the statistical inference results regarding these three effects were robust regardless whether or how careless responding was addressed. For the remaining five effects (two between-person effects and three within-person effects), the 99% CIs from the full sample analyses all excluded zero indicating statistically significant effects, whereas those from Subsample 2 analyses (which removed careless responding daily cases based only on ACQ2) all included zero indicating nonsignificant effects. These discrepancies between the full sample and Subsample 2 analyses may reflect both the smaller number of observations in the subsample (4013 daily cases in Subsample 2 vs. 4902 in the full sample) and the smaller effect estimates in the Subsample 2 analyses. Among the subsample analyses that used only a single screening method, the Subsample 2 results differed the most from the full sample results, whereas the statistical conclusions from Subsample 1 and Subsample 3 (removing daily cases based only on ACQ1 or RT screening) were largely consistent with the full sample analyses. Overall, these findings suggested that (1) statistical inference conclusions for these five effects were sensitive to whether and how careless responding is addressed and (2) false positives may be observed if careless responding is not addressed in longitudinal data analyses.
Careless responding poses a threat to the validity of survey-based research. However, most prior work has focused on cross-sectional designs and adult populations, leaving its prevalence, correlates, and impact largely unexplored in adolescent intensive longitudinal research. In this study, we investigated compliance rates as well as the prevalence, trends, and baseline survey correlates of careless responding using empirical data from 311 youths in a 21-day daily diary study. Compliance was indicated by whether daily responses were observed. Careless responding was detected at the daily level using two ACQs and RT screening, as these methods are relatively easy to administer and most widely used for data quality checking (Gottfried, 2024).
Our adolescent daily diary data revealed an average compliance rate of 75.1%, with the average rates of failing ACQ1, ACQ2, and RT screening being 6.6%, 18.1%, and 3.4%, respectively. The compliance rate was comparable to the pooled estimates from three meta-analyses of EMA studies focusing on child or adolescent samples (76% in Heron et al., 2017; 74% in van Roekel et al., 2019; 78.3% in Wen et al., 2017), as well as two meta-analyses of EMA studies focusing on adult samples (75.1% in Jones et al., 2019; 79% in Wrzus & Neubauer, 2023). The careless responding rates based on the ACQs were higher than that reported in an EMA study with college students (3.6%, measured via an ACQ; Eisele et al., 2022), but were comparable to or below the 95% CI (7.6%-16.5%) of the average prevalence rate estimate from a meta-analysis of alcohol research studies with adult samples (Jones et al., 2022). Regarding the relationship between compliance and careless responding, we found that youths with higher compliance were more likely to pass ACQs and RT screening. Overall, these findings supported the feasibility of collecting 21-day daily diaries with acceptable data quality from youths aged 12-16.
Comparing the passing rates of ACQs and RT screening, RT screening with the widely used 2-second-per-item rule had higher passing rates than the ACQs, with small or medium sized effects. Consistent with this pattern, the statistical conclusions from subsample analyses that removed careless responding daily cases based only on RT screening were mostly consistent with those from the full sample analyses that did not address potential careless responding. Among the subsample analyses that removed daily cases based only on one screening method, conclusions from those based only on ACQ2 differed the most from the full sample results. These findings suggested that RT screening may be less effective or less sensitive than ACQs for careless responding detection in adolescent daily diary research. This interpretation is consistent with prior recommendation that RT screening alone is insufficient for detecting careless responding (Kam & Meyer, 2015; Meade & Craig, 2012).
We also observed that the average pass rate for ACQ2 was significantly lower than for ACQ1, with small-medium sized effects. The daily questionnaire had 55 items, with ACQ1 placed in the first third and ACQ2 in the last third, suggesting that data quality intraindividually declined toward the end of the survey. Similarly, an experimental study with college students (Eisele et al., 2022) found that a longer questionnaire (60 vs. 30 items; between-subject factor) was associated with lower data quality, as measured by a momentary self-reported engagement item in EMAs. Our within-subject design with adolescents, which compared careless responses using two instructed response items measured each day, yielded consistent results. Together, these findings underscore the impact of questionnaire length on careless responding in EMAs and support the recommendation of using shorter surveys in intensive longitudinal research to reduce careless responding. Furthermore, it may be helpful to include more than one ACQ per assessment for careless responding detection in adolescent daily diary research.
However, it is also important to note that ACQ1 always instructed participants to select "Strongly agree" and ACQ2 always asked them to select "Strongly disagree", with both the wording and order fixed across participants and days. Thus, an alternative explanation for the difference in the passing rates of ACQ1 and ACQ2 is acquiescence bias, whereby inattentive respondents with a tendency to agree would be more likely to pass ACQ1 and fail ACQ2 regardless of the locations of the two ACQs. A limitation of the current study is that it cannot rule out this alternative explanation. Therefore, we suggest counterbalancing the order of the ACQs and the instructed responses across participants and days in future studies to disentangle the effects of questionnaire length, ACQ ordering, and acquiescence bias.
We found that ACQ pass rates significantly improved over days, whereas RT screening pass rates declined over time. These findings have important implications for detecting careless responding in daily diary and other intensive longitudinal research. First, learning or practice effects likely played a role. Youths became increasingly familiar with the item contents, including the ACQs, leading to faster responses and reduced reading time, as reflected in shorter response times over days. Despite the shorter response time over time, ACQ pass rates improved, likely due to growing familiarity with the ACQ contents. Second, the trend or practice effect was observed with a 21-day daily diary design. However, it is unclear whether this finding generalizes to intensive longitudinal studies with shorter or longer observation periods. Future research can examine study duration as a potential moderator of the practice effect. Third, we applied the widely used response time cutoff of 2 seconds per item for screening (Bowling et al., 2016), which was originally developed for cross-sectional studies where items are novel to participants. In intensive longitudinal research where participants repeatedly encounter the same items, a dynamic rather than static cutoff may be more appropriate. For example, researchers may apply the 1.5*IQR rule to each day's response time data to dynamically detect careless responding. Additionally, varying the ACQ contents or the number of ACQs across assessments may help optimize the detection of careless responding and reduce practice effects in intensive longitudinal research. Furthermore, other priori and less obtrusive items such as true/false items (e.g., "2+3 = 5") can be used. Future research should evaluate the effectiveness of these alternative approaches using longitudinal experimental designs.
To examine correlates of careless responding, we analyzed data from the Wave 1 baseline survey. The results revealed that youths with higher state anger (but not trait anger) and more neighborhood problems were more likely to fail ACQs, while older youths and those with higher anger control and better emotion regulation - cognitive appraisal were more likely to pass ACQs. These age-related results may help explain why college students had a very low prevalence of careless responding based on an ACQ in the EMA study by Eisele et al. (2022) and why adolescents had higher prevalence rates of careless responding based on the two ACQs in our daily diary study. Our findings highlighted the importance of including careless responding screening methods such as ACQs in daily diary or other intensive longitudinal research with adolescents and youths.
When careless responding is detected, concern about data quality arise, and intensive longitudinal data are no exception. However, there is currently no consensus in the literature on how to handle careless responding. Some researchers recommended removing careless data from analyses. Yet, as discussed earlier in the paper, certain detection methods such as response time screening require arbitrary cutoffs for decision making. Moreover, different detection methods may lead to different detection decisions. Indeed, our analyses showed that different detection methods produced different subsamples that passed careless responding screening. We also demonstrated that different statistical conclusions can be obtained from the full sample and various subsample analyses. Specifically, our full sample analyses that did not address careless responding produced inflated, deflated, or similar estimates of between- and within-person effects compared with those obtained from subsample analyses. Consistent with Stosic et al. (2024), we also observed that statistically significant findings in the full sample analyses can become nonsignificant after removing careless response cases. Together, these results suggested that failing to address careless responding in longitudinal data analyses may lead to false-positive conclusions.
Therefore, as a practical guideline, we recommend including ACQs in addition to monitoring RT to help detect careless responding in intensive longitudinal research. We also recommend transparently evaluating the impact of careless responding on statistical analysis results by (1) conducting sensitivity analyses that compare conclusions from the full sample with those from subsamples defined by different careless responding screening methods (e.g., ACQs and RT screening), and (2) reporting results from both the full sample and subsample analyses. This recommendation aligns with best practices for handling missing data (Daniels & Hogan, 2008; Permutt, 2016) and addressing omitted confounders in causal inference (Cinelli & Hazlett, 2020; Liu & Wang, 2021; Robins, Rotnitzky, & Scharfstein, 2000). When results are consistent across samples, researchers can be more confident in their findings. When results differ, greater caution is warranted in interpretation, and additional data may be needed to test hypotheses. Regardless of whether sensitivity analyses yield robust or sensitive findings, we advocate conducting and reporting sensitivity analyses using both the full sample and subsamples defined by careless responding screening methods to enhance the transparency and robustness of longitudinal research.
In conclusion, we recommend reducing careless responding using shorter surveys as well as incorporating momentary attention check questions and recording response time to help detect careless responding in adolescent intensive longitudinal research. Furthermore, conducting sensitivity analyses can help assess the impact of careless responding on intensive longitudinal data analysis results. We hope this study encourages future research on careless responding to enhance the quality of adolescent intensive longitudinal data collection and analysis.
Alegría, M., Cruz-Gonzalez, M., Yip, T., Wang, L., Fang, Y., Park, I. J. K., Shrout, P. E. (2026). Protective factors of the longitudinal association between discrimination and mental health among mexican-origin youth. Journal of the American Academy of Child and Adolescent Psychiatry. doi: https://doi.org/10.1016/j.jaac.2026.01.012
Alegría, M., Cruz-Gonzalez, M., Yip, T., Wang, L., Park, I. J. K., Fukuda, M., Shrout, P. E. (2024). Yearly and daily discrimination-related stressors and mexican youth's mental health and sleep: Insights from the first wave of a three-wave family study. Journal of the American Academy of Child and Adolescent Psychiatry, 63(11), 1134-1148. doi: https://doi.org/10.1016/j.jaac.2023.12.010
Asparouhov, T., & Muthén, B. (2019). Latent variable centering of predictors and mediators in multilevel and time-series models. Structural Equation Modeling: A Multidisciplinary Journal, 26(1), 119-142. doi: https://doi.org/10.1080/10705511.2018.1511375
Asparouhov, T., & Muthén, B. (2021). Expanding the bayesian structural equation, multilevel and mixture models to logit, negative-binomial, and nominal variables. Structural Equation Modeling: A Multidisciplinary Journal, 28(4), 622-637. doi: https://doi.org/10.1080/10705511.2021.1878896
Bolger, N., & Laurenceau, J. P. (2013). Intensive longitudinal methods: An introduction to diary and experience sampling research. Guilford press.
Bowling, N. A., Huang, J. L., Bragg, C. B., Khazon, S., Liu, M., & Blackmore, C. E. (2016). Who cares and who is careless? Insufficient effort responding as a reflection of respondent personality. Journal of Personality and Social Psychology, 111(2), 218-229. doi: https://doi.org/10.1037/pspp0000085
Brunner, T. M., & Spielberger, C. D. (2009). The State Trait Anger Expression Inventory, Second Edition, Child Adolescent (STAXI-C/A). Psychological Assessment Resources.
Cinelli, C., & Hazlett, C. (2020). Making sense of sensitivity: Extending omitted variable bias. Journal of the Royal Statistical Society Series B: Statistical Methodology, 82(1), 39-67. doi: https://doi.org/10.1111/rssb.12348
Cohen, S., Kamarck, T., & Mermelstein, R. (1983). A global measure of perceived stress. Journal of Health and Social Behavior, 24(4), 385-396. doi: https://doi.org/10.2307/2136404
Curran, P. G. (2016). Methods for the detection of carelessly invalid responses in survey data. Journal of Experimental Social Psychology, 66, 4-19. doi: https://doi.org/10.1016/j.jesp.2015.07.006
Daniels, M. J., & Hogan, J. W. (2008). Missing data in longitudinal studies: Strategies for Bayesian modeling and sensitivity analysis. Chapman and Hall/CRC. doi: https://doi.org/10.1201/9781420011180
Eisele, G., Vachon, H., Lafit, G., Kuppens, P., Houben, M., Myin-Germeys, I., & Viechtbauer, W. (2022). The effects of sampling frequency and questionnaire length on perceived burden, compliance, and careless responding in experience sampling data in a student population. Assessment, 29(2), 136-151. doi: https://doi.org/10.1177/1073191120957102
Feng, Y., Cheon, Y. M., Yip, T., & Cham, H. (2021). Multilevel IRT analysis of the Everyday Discrimination Scale and the Racial/Ethnic Discrimination Index. Psychological Assessment, 33(7), 637-651. doi: https://doi.org/10.1037/pas0000906
Gottfried, J. (2024). Practices in data-quality evaluation: A large-scale review of online survey studies published in 2022. Advances in Methods and Practices in Psychological Science, 7(2), 1-7. doi: https://doi.org/10.1177/25152459241236414
Gross, J. J., & John, O. P. (2003). Individual differences in two emotion regulation processes: Implications for affect, relationships, and well-being. Journal of Personality and Social Psychology, 85(2), 348-362. doi: https://doi.org/10.1037/0022-3514.85.2.348
Hamaker, E. L., & Wichers, M. (2017). No time like the present: Discovering the hidden dynamics in intensive longitudinal data. Current Directions in Psychological Science, 26(1), 10-15. doi: https://doi.org/10.1177/0963721416666518
Heron, K. E., Everhardt, R. S., McHale, S. M., & Smyth, J. M. (2017). Using mobile-technology-based ecological momentary assessment (EMA) methods with youth: A systematic review and recommendations. Journal of Pediatric Psychology, 42(10), 1087- 1107. doi: https://doi.org/10.1093/jpepsy/jsx078
Huang, J. L., Bowling, N. A., Liu, M., & Li, Y. (2015). Detecting insufficient effort responding with an infrequency scale: Evaluating validity and participant reactions. Journal of Business and Psychology, 30, 299-311. doi: https://doi.org/10.1007/s10869-014-9357-6
Jones, A., Earnest, J., Adam, M., Clarke, R., Yates, J., & Pennington, C. R. (2022). Careless responding in crowdsourced alcohol research: A systematic review and meta-analysis of practices and prevalence. Experimental and Clinical Psychopharmacology, 30(4), 381- 399. doi: https://doi.org/10.1037/pha0000546
Jones, A., Remmerswaal, D., Verveer, I., Robinson, E., Franken, I. H., Wen, C. K. F., & Field, M. (2019). Compliance with ecological momentary assessment protocols in substance users: A meta-analysis. Addiction, 114(4), 609-619. doi: https://doi.org/10.1111/add.14503
Kam, C. C. S., & Chan, G. H.-h. (2018). Examination of the validity of instructed response items in identifying careless respondents. Personality and Individual Differences, 129, 83-87. doi: https://doi.org/10.1016/j.paid.2018.03.022
Kam, C. C. S., & Meyer, J. P. (2015). How careless responding and acquiescence response bias can influence construct dimensionality: The case of job satisfaction. Organizational Research Methods, 18(3), 512-541. doi: https://doi.org/10.1177/1094428115571894
Kung, F. Y. H., Kwok, N., & Brown, D. J. (2018). Are attention check questions a threat to scale validity? Applied Psychology, 67(2), 264-283. doi: https://doi.org/10.1111/apps.12108
Laurenceau, J. P., DiGiovanni, A. M., & Bolger, N. (2026). Intensive longitudinal methods: Toward a psychological science of daily life. Annual Review of Psychology, 77(5), 513- 541. doi: https://doi.org/10.1146/annurev-psych-040325-025418
Liu, X., & Wang, L. (2021). The impact of measurement error and omitting confounders on statistical inference of mediation effects and tools for sensitivity analysis. Psychological Methods, 26(3), 327-342. doi: https://doi.org/10.1037/met0000345
Loeber, R., Farrington, D. P., Stouthamer-Loeber, M., & Van Kammen, W. B. (1998). Antisocial behavior and mental health problems: Explanatory factors in childhood and adolescence. Psychology Press. doi: https://doi.org/10.4324/9781410602930
Meade, A. W., & Craig, S. B. (2012). Identifying careless responses in survey data. Psychological Methods, 17(3), 437-455. doi: https://doi.org/10.1037/a0028085
Mehl, M. R., & Conner, T. S. (2012). Handbook of research methods for studying daily life. The Guilford Press.
Park, I. J. K., Wang, L., Li, R., Yip, T., Valentino, K., Cruz-Gonzalez, M., Alegría, M. (2024). A daily diary study of discrimination and distress in mexican-origin adolescents: Testing mediating mechanisms. Child Development, 95(5), 1754-1769. doi: https://doi.org/10.1111/cdev.14108
Permutt, T. (2016). Sensitivity analysis for missing data in regulatory submissions. Statistics in Medicine, 35(17), 2876-2879. doi: https://doi.org/10.1002/sim.6753
Robins, J. M., Rotnitzky, A., & Scharfstein, D. O. (2000). Sensitivity analysis for selection bias and unmeasured confounding in missing data and causal inference models. In Statistical models in epidemiology, the environment, and clinical trials (p. 1-94). New York, NY: Springer. doi: https://doi.org/10.1007/978-1-4612-1284-3_1
Stosic, M. D., Murphy, B. A., Duong, F., Fultz, A. A., Harvey, S. E., & Bernieri, F. (2024). Careless responding: Why many findings are spurious or spuriously inflated. Advances in Methods and Practices in Psychological Science, 7(1), 1-19. doi: https://doi.org/10.1177/25152459241231581
Ulitzsch, E., Nestler, S., Lüdtke, O., & Nagy, G. (2024). A screen-time-based mixture model for identifying and monitoring careless and insufficient effort responding in ecological momentary assessment data. Psychological Methods. Advance online publication. doi: https://doi.org/10.1037/met0000636
Ulitzsch, E., Viechtbauer, W., Lüdtke, O., Myin-Germeys, I., Nagy, G., Nestler, S., & Eisele, G. V. (2025). Investigating the effect of experience sampling study design on careless and insufficient effort responding identified with a screen-time-based mixture model. Psychological Assessment, 37(8), 347-359. doi: https://doi.org/10.1037/pas0001379
Valentino, K., Park, I. J. K., Cruz-Gonzalez, M., Zhen-Duan, J., Wang, L., Yip, T., Alegría, M. (2025). Family-level moderators of daily associations between discrimination and distress among Mexican-origin youth. Development and Psychopathology, 37(2), 902-917. doi: https://doi.org/10.1017/S0954579424000749
van Roekel, E., Keijsers, L., & Chung, J. M. (2019). A review of current ambulatory assessment studies in adolescent samples and practical recommendations. Journal of Research on Adolescence, 29(3), 560-577. doi: https://doi.org/10.1111/jora.12471
Vogelsmeier, L. V. D. E., Jongerling, J., & Ulitzsch, E. (2025). Accounting for measurement invariance violations in careless responding detection in intensive longitudinal data: Exploratory vs partially constrained latent markov factor analysis. Multivariate Behavioral Research, 60(5), 878-897. doi: https://doi.org/10.1080/00273171.2025.2492016
Wang, L., Hamaker, E., & Bergeman, C. (2012). Investigating inter-individual differences in short-term intra-individual variability. Psychological Methods, 17(4), 567-581. doi: https://doi.org/10.1037/a0029317
Wang, L., & Maxwell, S. E. (2015). On disaggregating between-person and within-person effects with longitudinal data using multilevel models. Psychological Methods, 20(1), 63-83. doi: https://doi.org/10.1037/met0000030
Wang, L., Zhang, Z., McArdle, J. J., & Salthouse, T. A. (2008). Investigating ceiling effects in longitudinal data analysis. Multivariate Behavioral Research, 43(3), 476-496. doi: https://doi.org/10.1080/00273170802285941
Ward, M. K., & Meade, A. W. (2023). Dealing with careless responding in survey data: Prevention, identification, and recommended best practices. Annual Review of Psychology, 74(1), 577-596. doi: https://doi.org/10.1146/annurev-psych-040422-045007
Watson, D., Clark, L. A., & Tellegen, A. (1988). Development and validation of brief measures of positive and negative affect: the PANAS scales. Journal of Personality and Social Psychology, 54(6), 1063-1070. doi: https://doi.org/10.1037/0022-3514.54.6.1063
Wen, C. K. F., Schneider, S., Stone, A. A., & Spruijt-Metz, D. (2017). Compliance with mobile ecological momentary assessment protocols in children and adolescents: A systematic review and meta-analysis. Journal of Medical Internet Research, 19(4), Article e132. doi: https://doi.org/10.2196/jmir.6641
Wrzus, C., & Neubauer, A. B. (2023). Ecological momentary assessment: A meta-analysis on designs, samples, and compliance across research fields. Assessment, 30(3), 825-846. doi: https://doi.org/10.1177/10731911211067538
Yang, M., Schick, M. R., Sullivan, T. P., & Weiss, N. H. (2024). Predicting completion of ecological momentary assessments among substance-using women experiencing intimate partner violence. Assessment, 31(7), 1398-1413. doi: https://doi.org/10.1177/10731911231216948
Yip, T., Wang, Y., & Zhao, A. (2025). Promises and pitfalls of experience sampling methods for understanding developmental processes. Annual Review Developmental Psychology, 7, 439-460. doi: https://doi.org/10.1146/annurev-devpsych-111323-095203